Agriboost
Voted First Place Capstone Project 2019
Voted First Place Capstone Project 2019
At the end of undergraduate engineering, a group project is given to all engineers, wherein we must reflect the skills we've learned throughout our undergraduate education experience. Showcasing not only the technical skills that we've picked up in:
- Software Engineering
- Mechanical Engineering
- Electrical Engineering
But also, teamwork, project management, problem-solving and other interpersonal skills that we've cultivated and will need as future engineers.
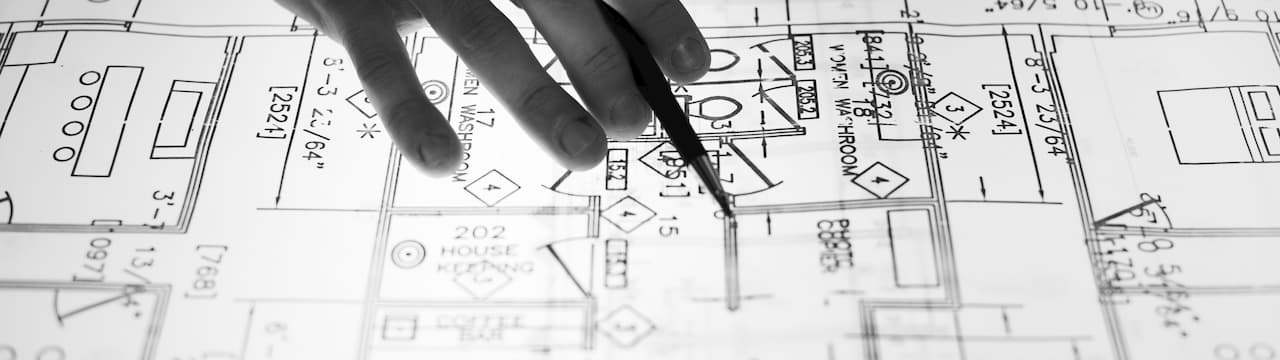
For this task we were given free rain on project choice, and provided engineering documents along the way, specifically:
- A Contract of what we will deliver
- System Requirements
- System Design
- Hazard Analysis and Mitigation
Our team treated this project as realistically as possible establish a company name Eltrotech, and a product Agriboost as our goal was to boost agriculture growth or at least optimize the process.
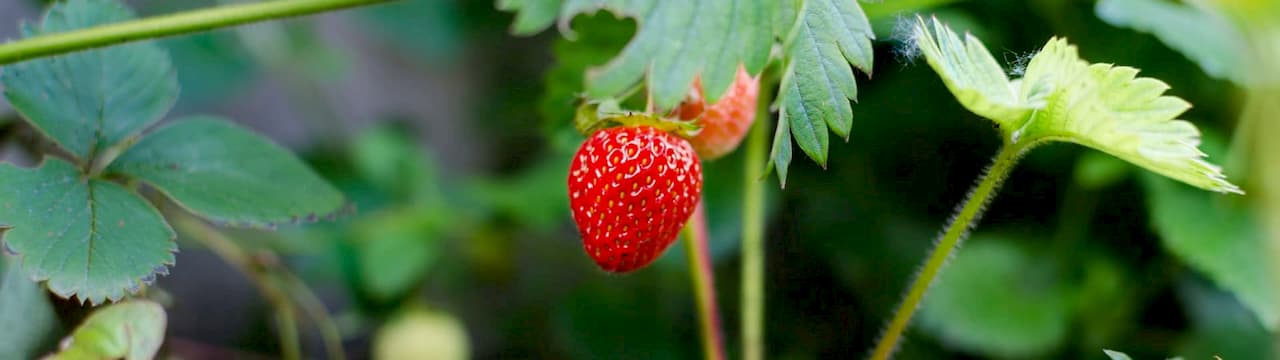
Acting professionally we began by doing heavy research into the
Precision Agriculture industry and competing monitoring systems. We found that there were two types of sensor systems out there standalone single sensor systems and ones that are more similar to ours with an array of sensors. These all had one thing in common though and that was the high price tag $$$$$ so we set out with a goal of getting this same system ready for a farmer to use at a much lower cost, as a system that costs ~$1000 for a single node doesn't seem expensive until you scale it to the size of a farmers field at which point costs add up.
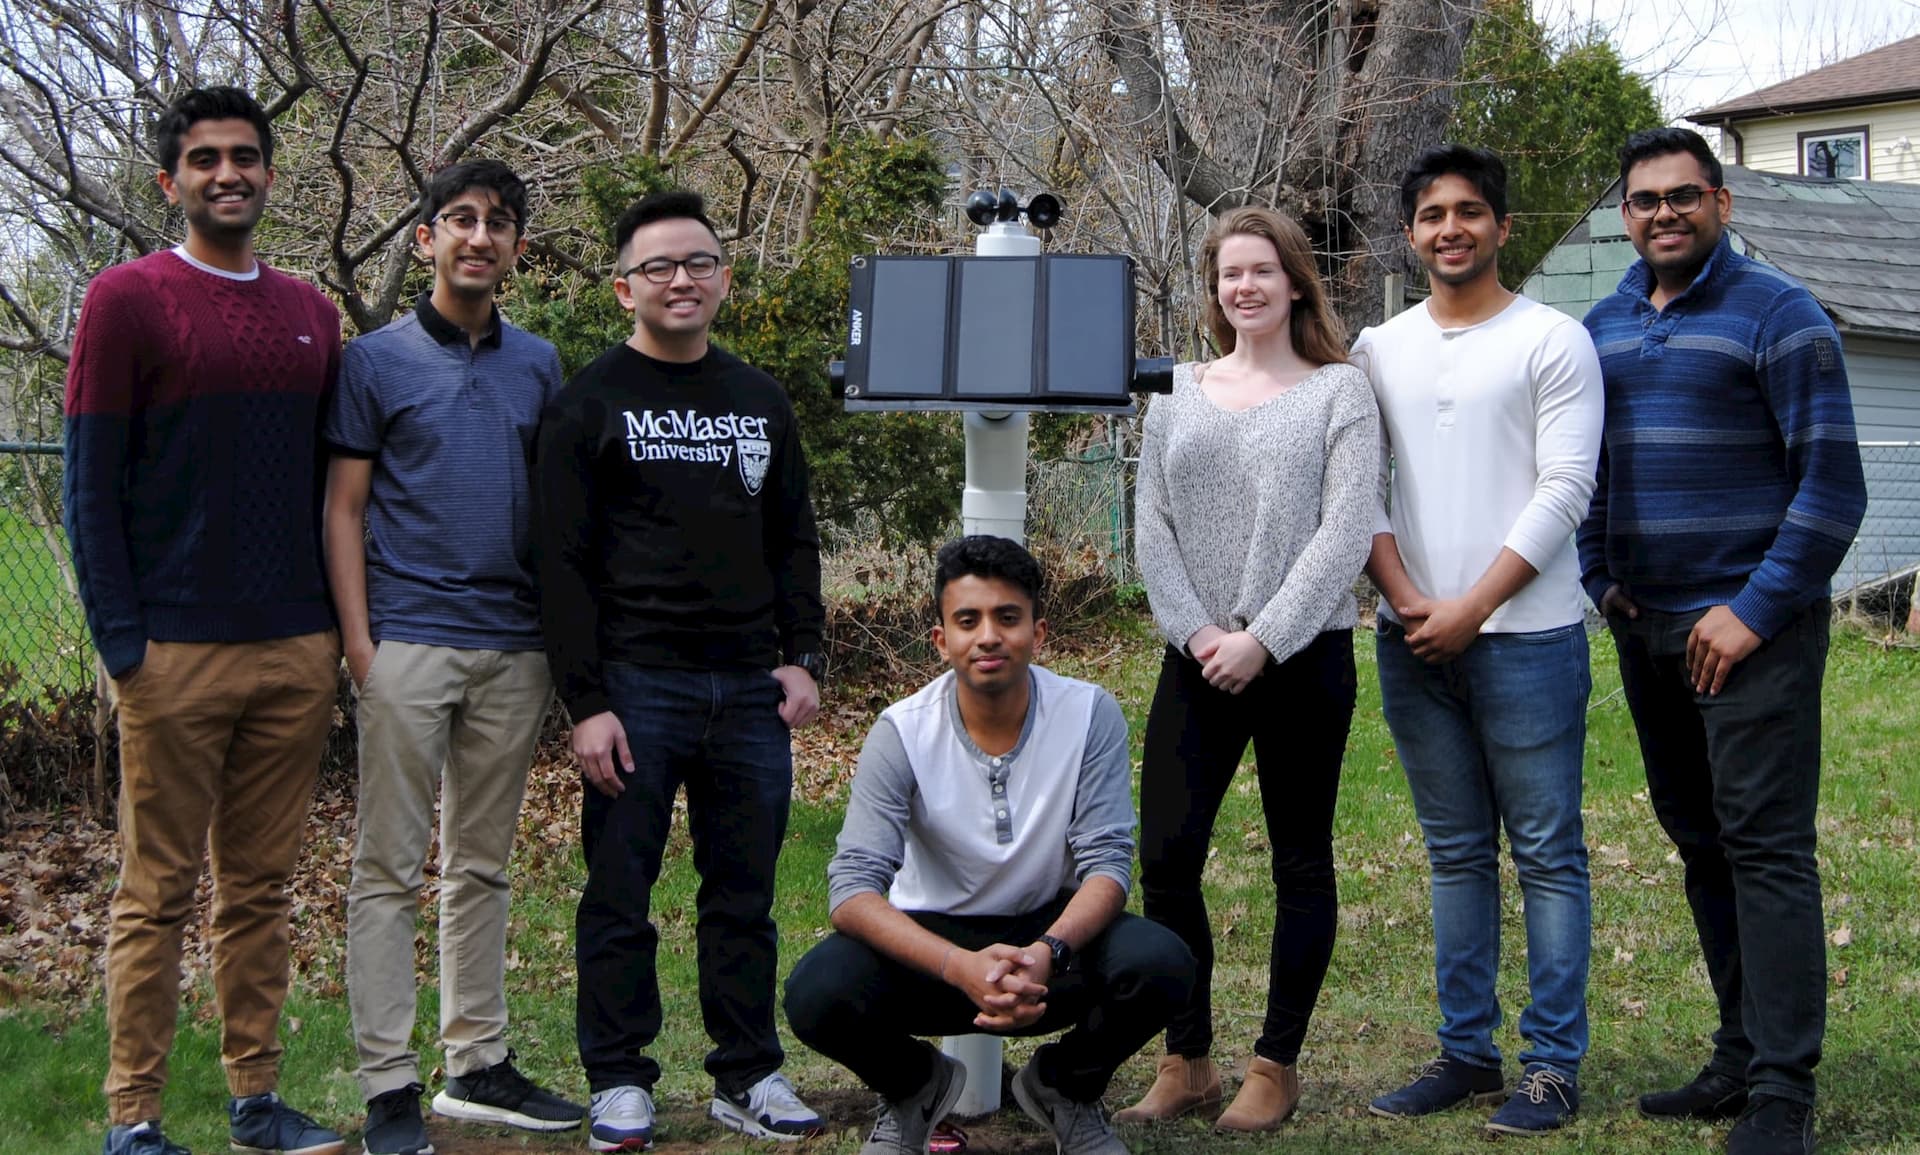
So with this in mind our team of 7 were determined to provide a good system at a low cost to at least from a proof of concept point of view show that, farmers do not need to pay as much as they are for systems that can optimize crop-yields, because in the end we all need food, and in the near future we will need a lot more of it.
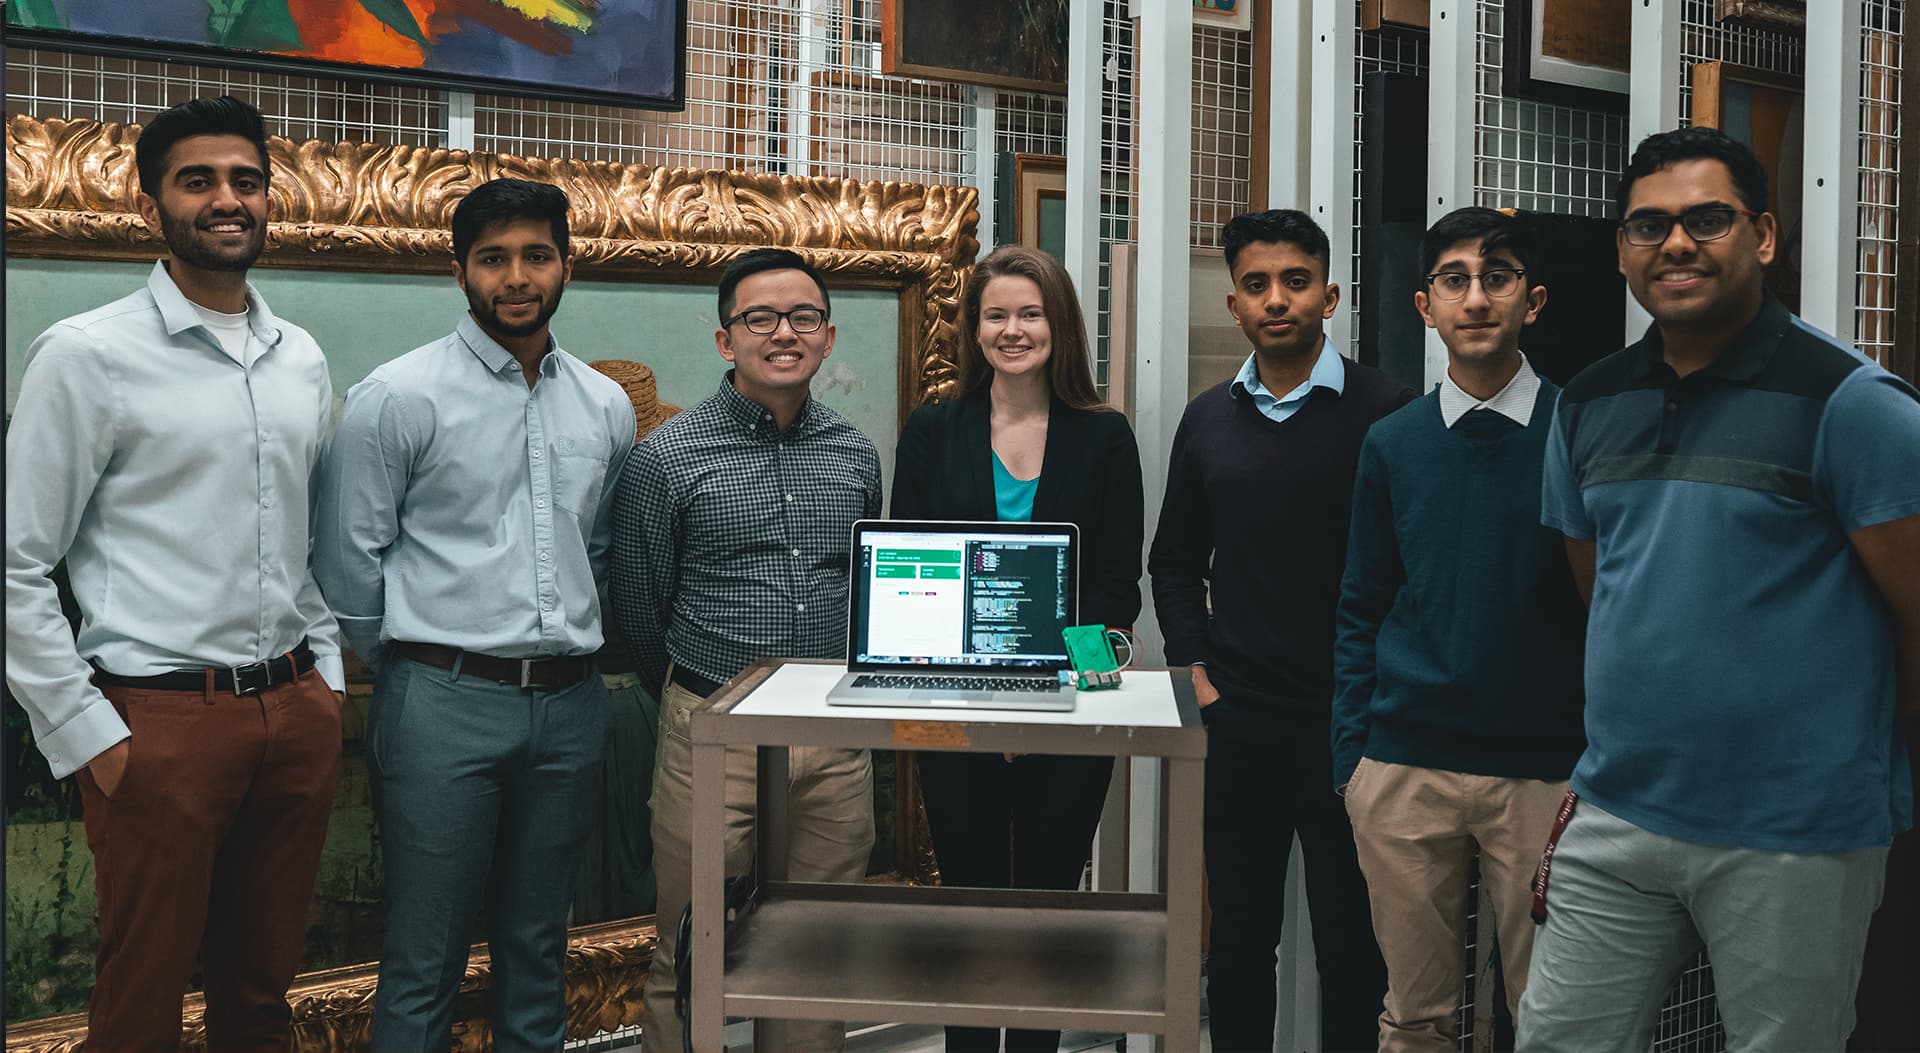
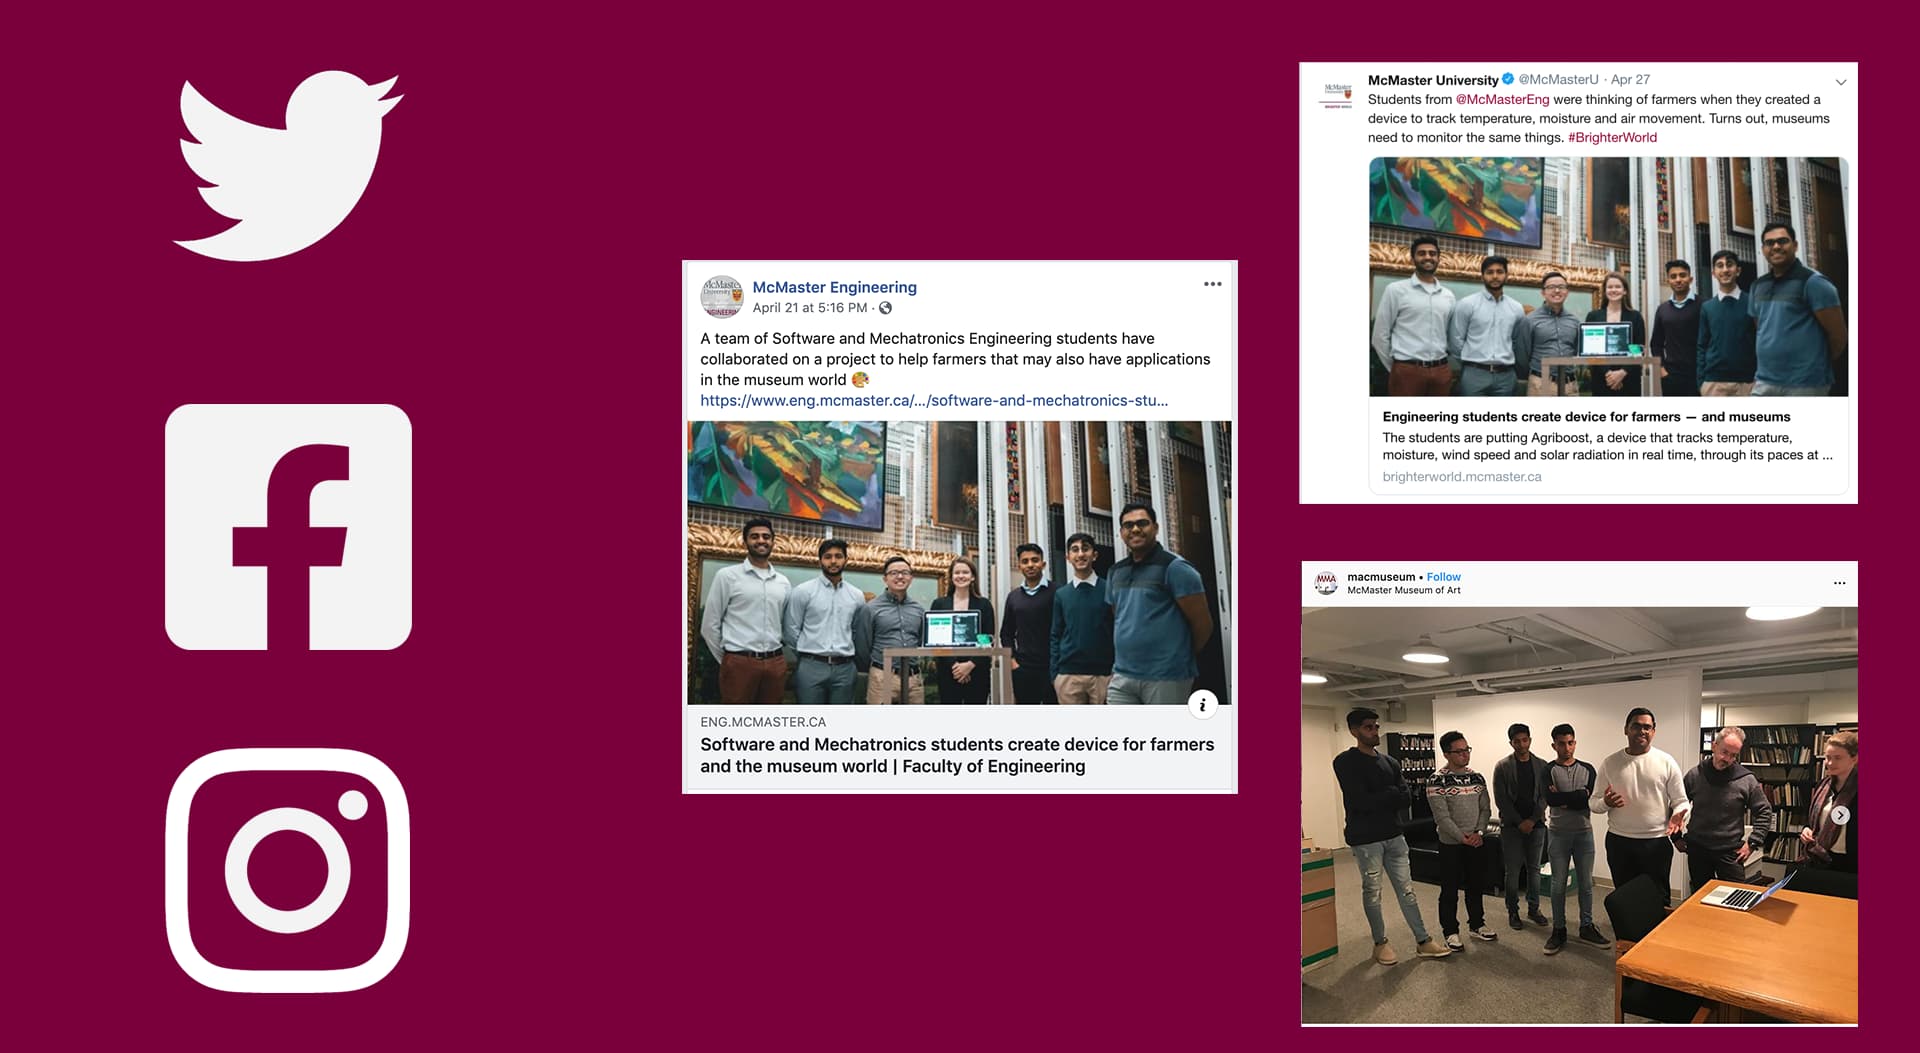
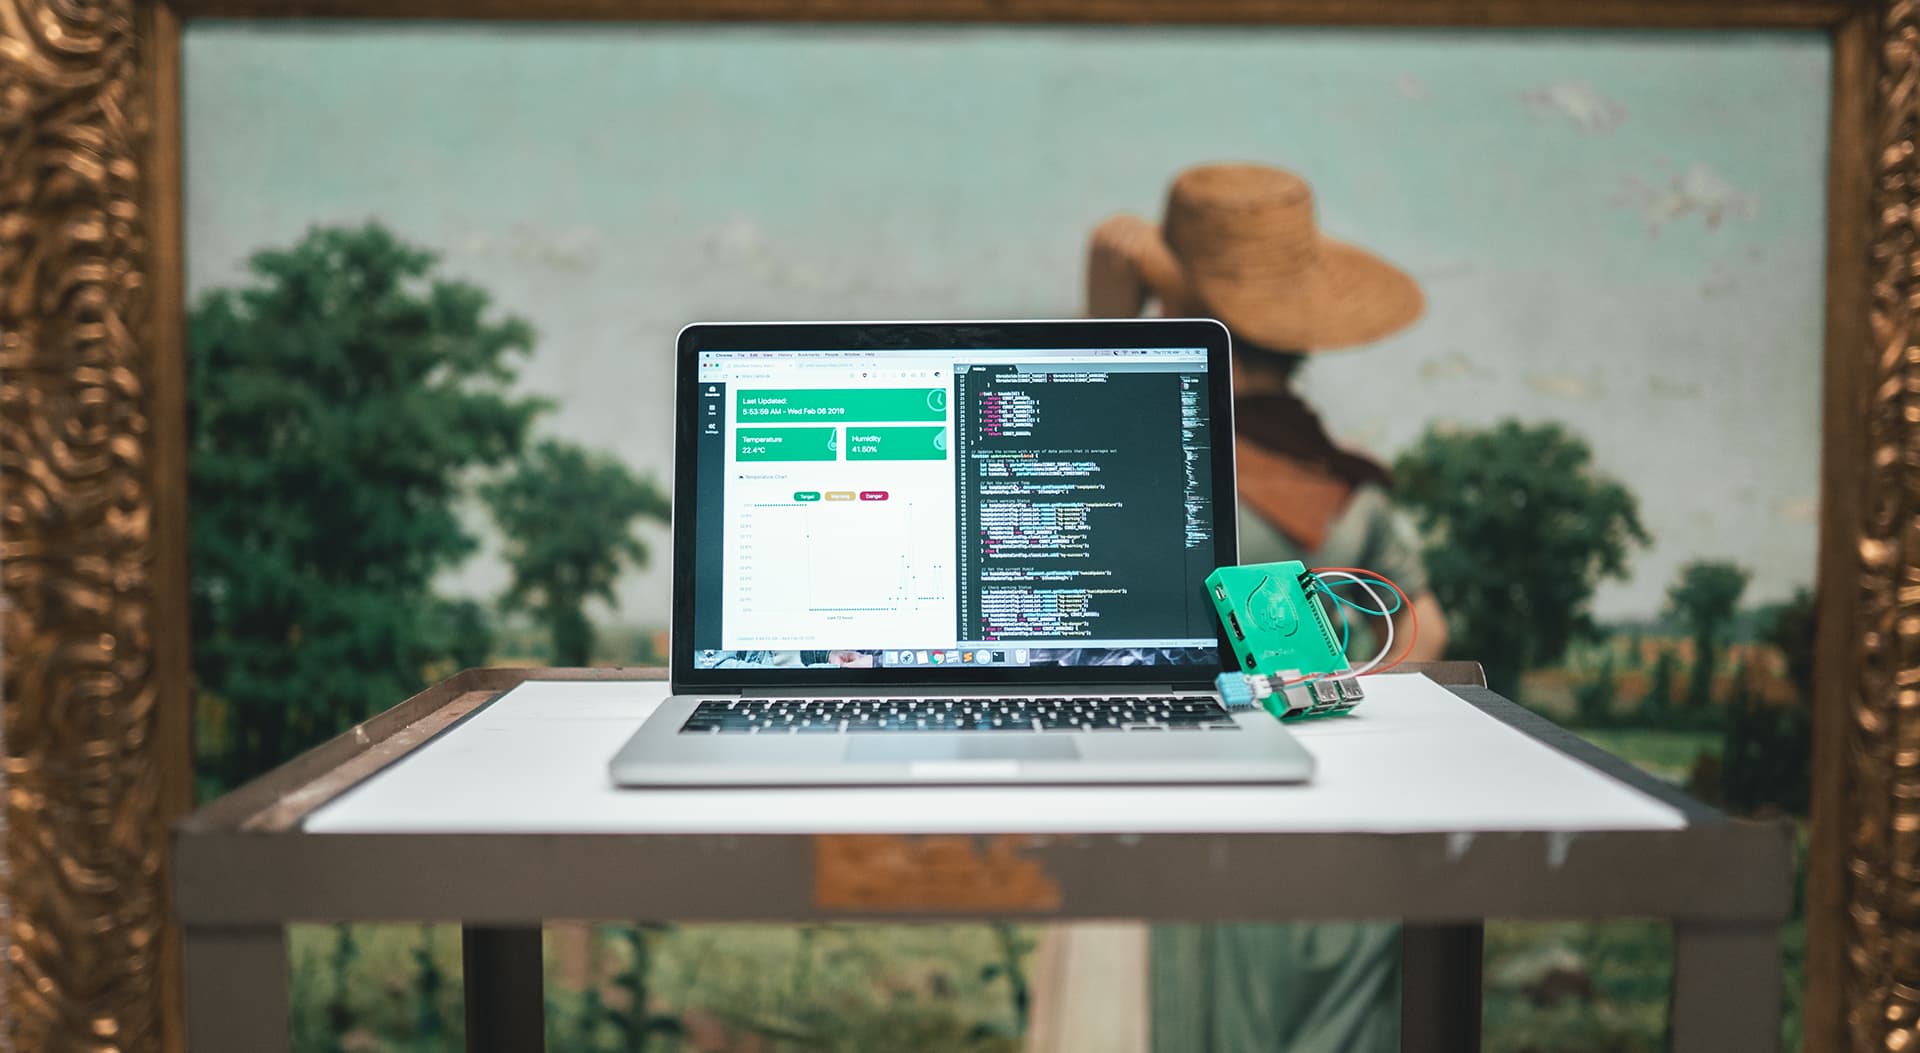
The McMaster Museum of Art was kind enough to allow us to test run our system in their vaults where paintings including some by Van Goh are kept since the gallery constantly cycles what they put on display.
In these vaults they have to track humidity and temperature and make sure they are within a certain range, to make sure that the paintings are not damaged, this is all tracked using analog technology and physical data sheets using a hygrothermograph. Where records must be kept on hand for years at a time and with multiple vaults, and years of data stored on 30-day reals this is a lot of information to keep, and when duplicates need to be made and send off when requesting more art pieces it is overall a major hassle.
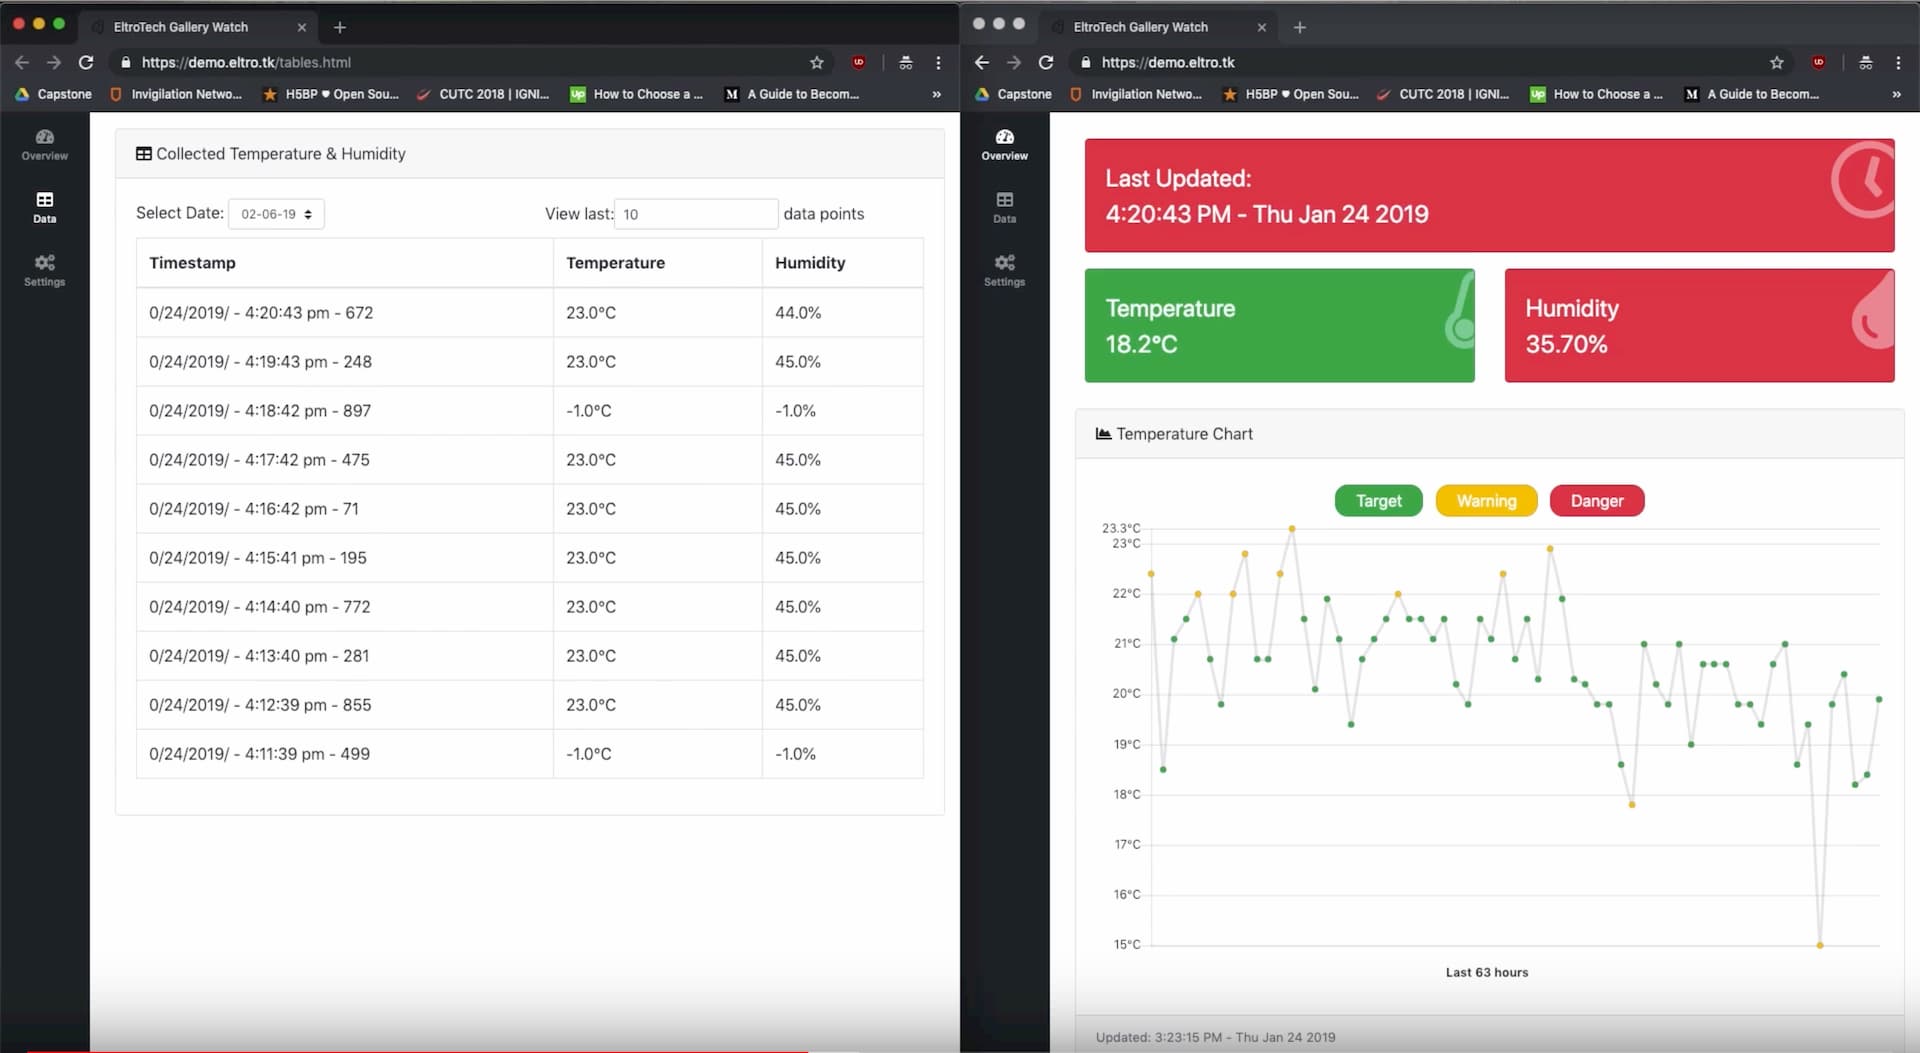
So Eltrotech took a subset of Agriboost and implemented it in the museum to keep a digital record of the humidity and temperature online, where data can be easily tabulated and exported. During our term working with the museum before renovations, we collected data and were able to verify,
against the tried and tested hygrothermographs in place that our sensors are accurate.
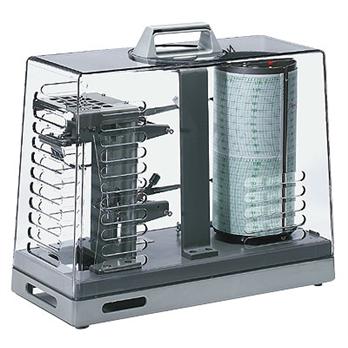
The art industry relies on 18th-century technology, namely the Hygrothermograph, which tracks humidity and temperature data on a reel that can track 30 days worth of data.
The system uses human hair attached to a bimetallic strip that is especially sensitive to humidity and temperature variations to track the current conditions.
Agriboost is an all in one system designed to survive and sustain itself in a farmers field from last to the first frost while hosting over 15 different sensors. This is a little overkill for an art gallery, as we do not need to worry about the elements or power since there is hardline power.
So we stripped down our system using one combined humiture sensor to collect temperature and humidity data, stripping the chassis, power system and sensors down and implementing in the museum.
In October of 2018 we wrote a contract saying that we would deliver an in and above ground field sensor network that met these four criteria:
- Collect, validate and tabulate relevant agricultural data for the farmer. Relevant data
includes information that is timely, accurate and applicable.
- Present said data to the farmer, which the farmer will be able to access remotely through
web-based application(s).
- Operate in an agricultural environment; meaning it should be able to withstand the typical
horticultural growing season environment of Southern Ontario (last frost until first frost).
The system will have preferences for the farmer to update while using it over this time.
- Keep its data secured between deployed hardware through end to end encryption.
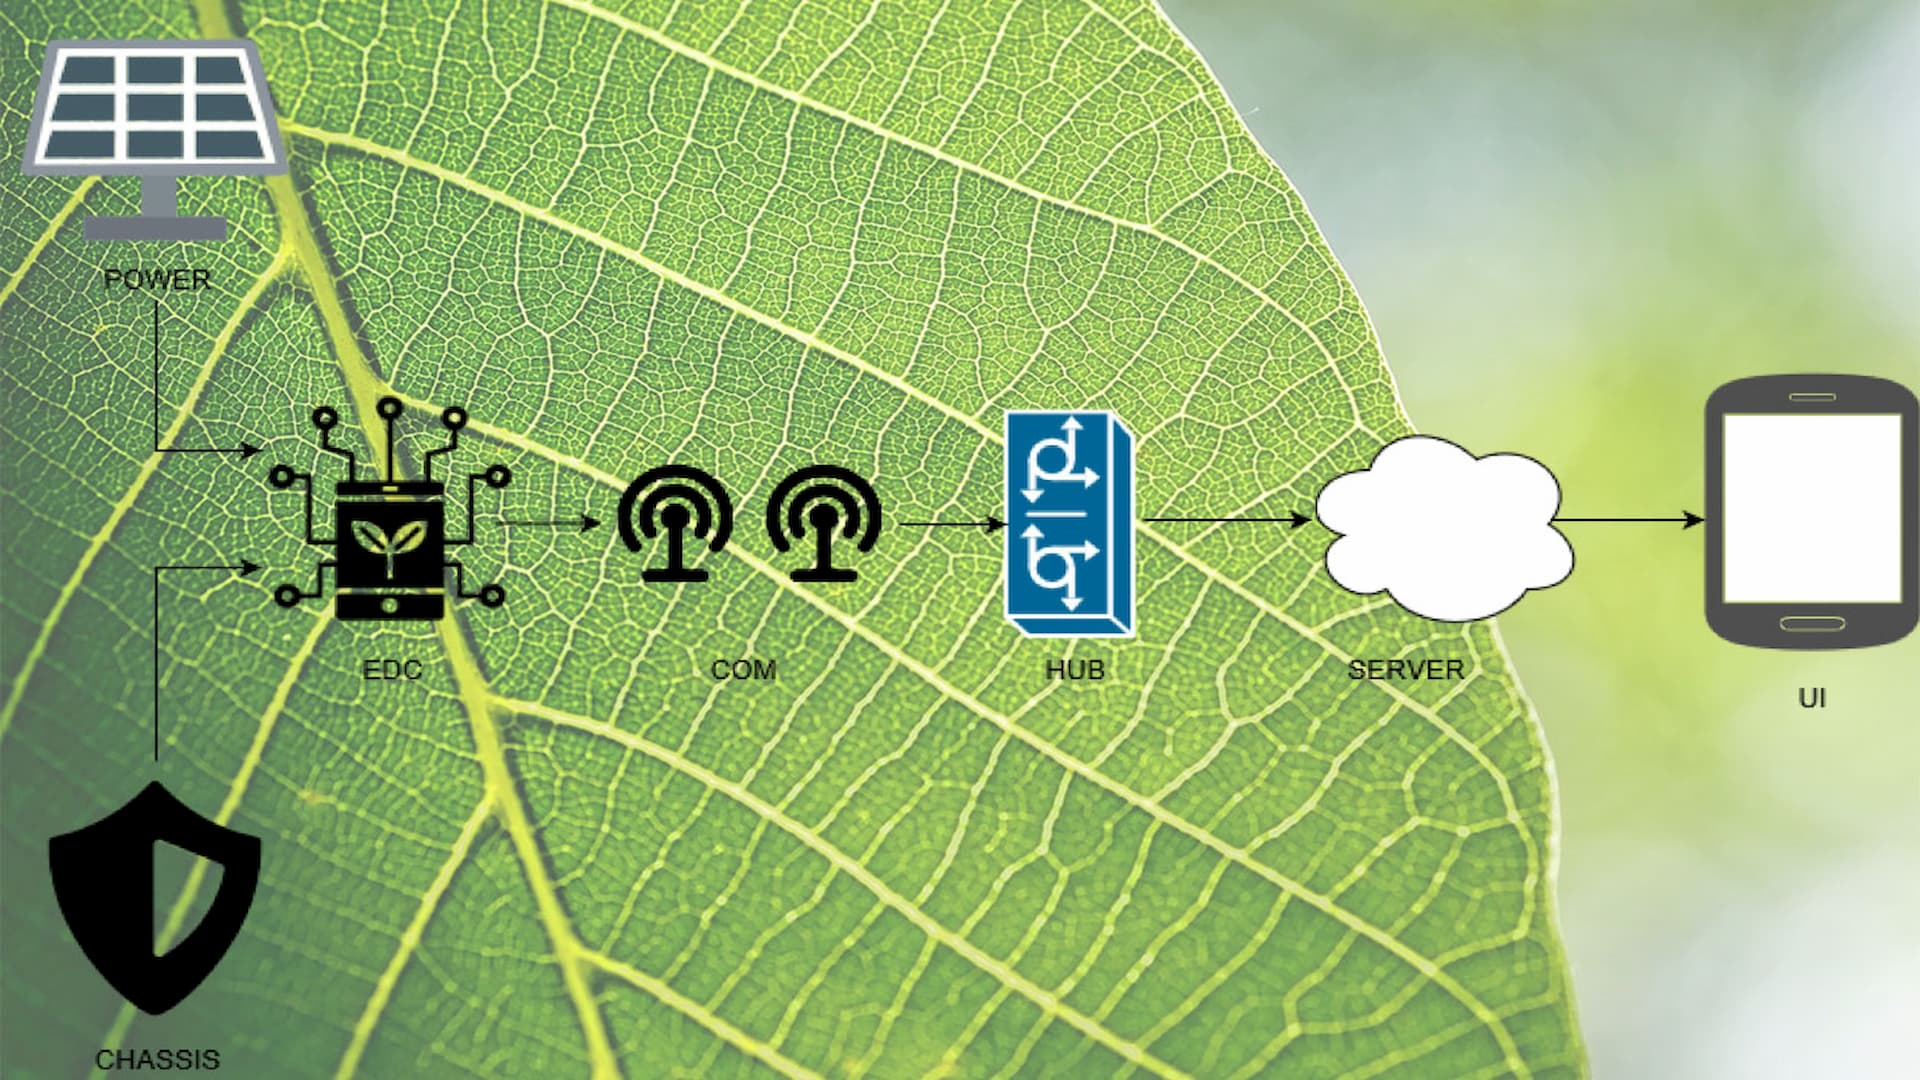
The Power System is key as it needs to provide the field node with consistent power from the last frost to the first frost of the year, which in agriculture is defined as the growing season.
The power team was constrained to power itself with no connection to landline power, as we do not want the farmer to have to run cables into their field for obvious reasons.
Accounting for on average of 48 hours of cloud cover in a week with outlier situations of 72 hours, the team designed the system to handle a worst case scenario which was 72 hours of continuous cloud cover.
The team chooses their battery size and the size of their solar panel based off of this situation, using the average power draw calculated by the EDC team.
Accounting for extremely rare situations and guarding against weeks with greater than 72 hours of cloud cover the team developed, a safe shutdown and startup process, so the field node turns off when there is not enough power and starts back up when there is enough.

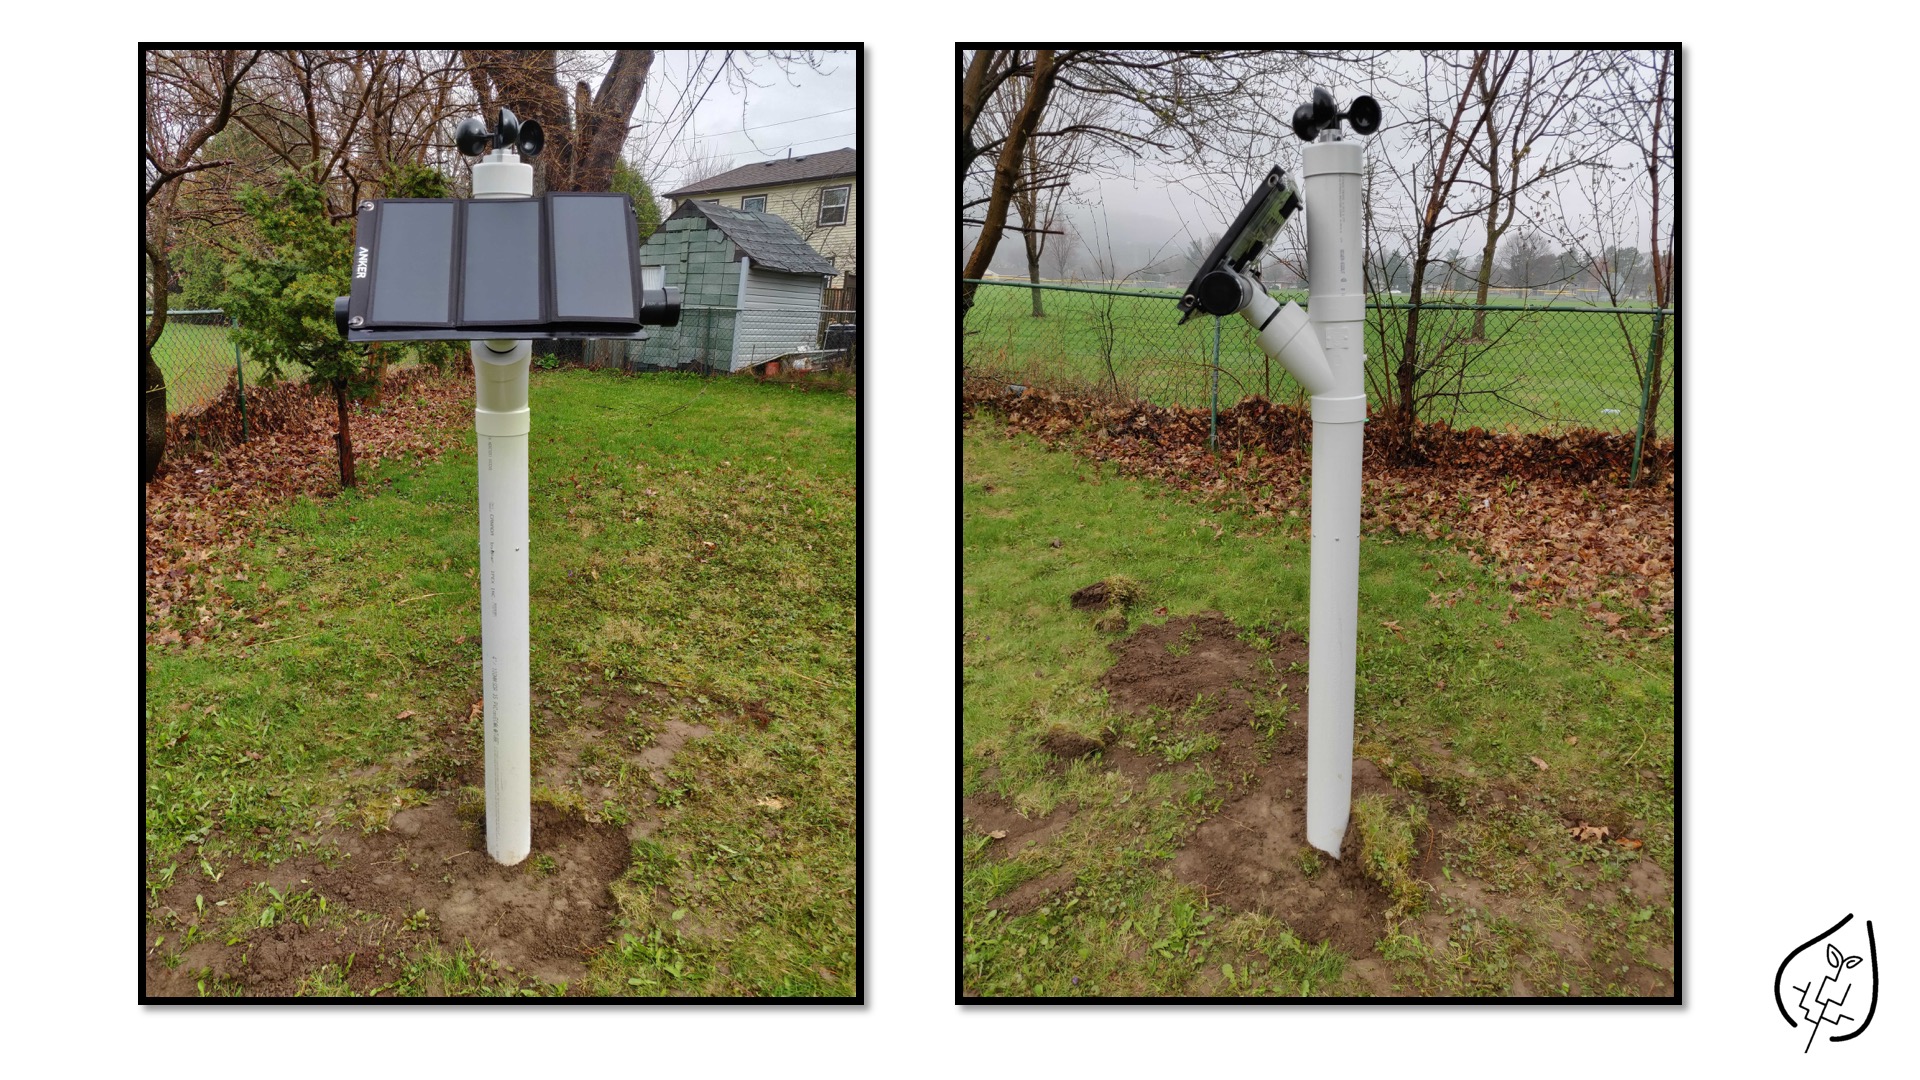
The Chassis team had to ensure that like the power system, our node would remain operational for the duration of the growing season and be robust enough to handle extreme weather conditions and relocation over the estimated lifetime of the product.
The team had to make sure there was space for all sensors and the batteries while providing sufficient protection for sensitive sensors and for components that are not water resistant.
The chassis also has a circular underground plate, which prevents the node from falling over from wind or a light nudge, by providing opposite forces on each side of the unit depending on the force and direction of the hit.
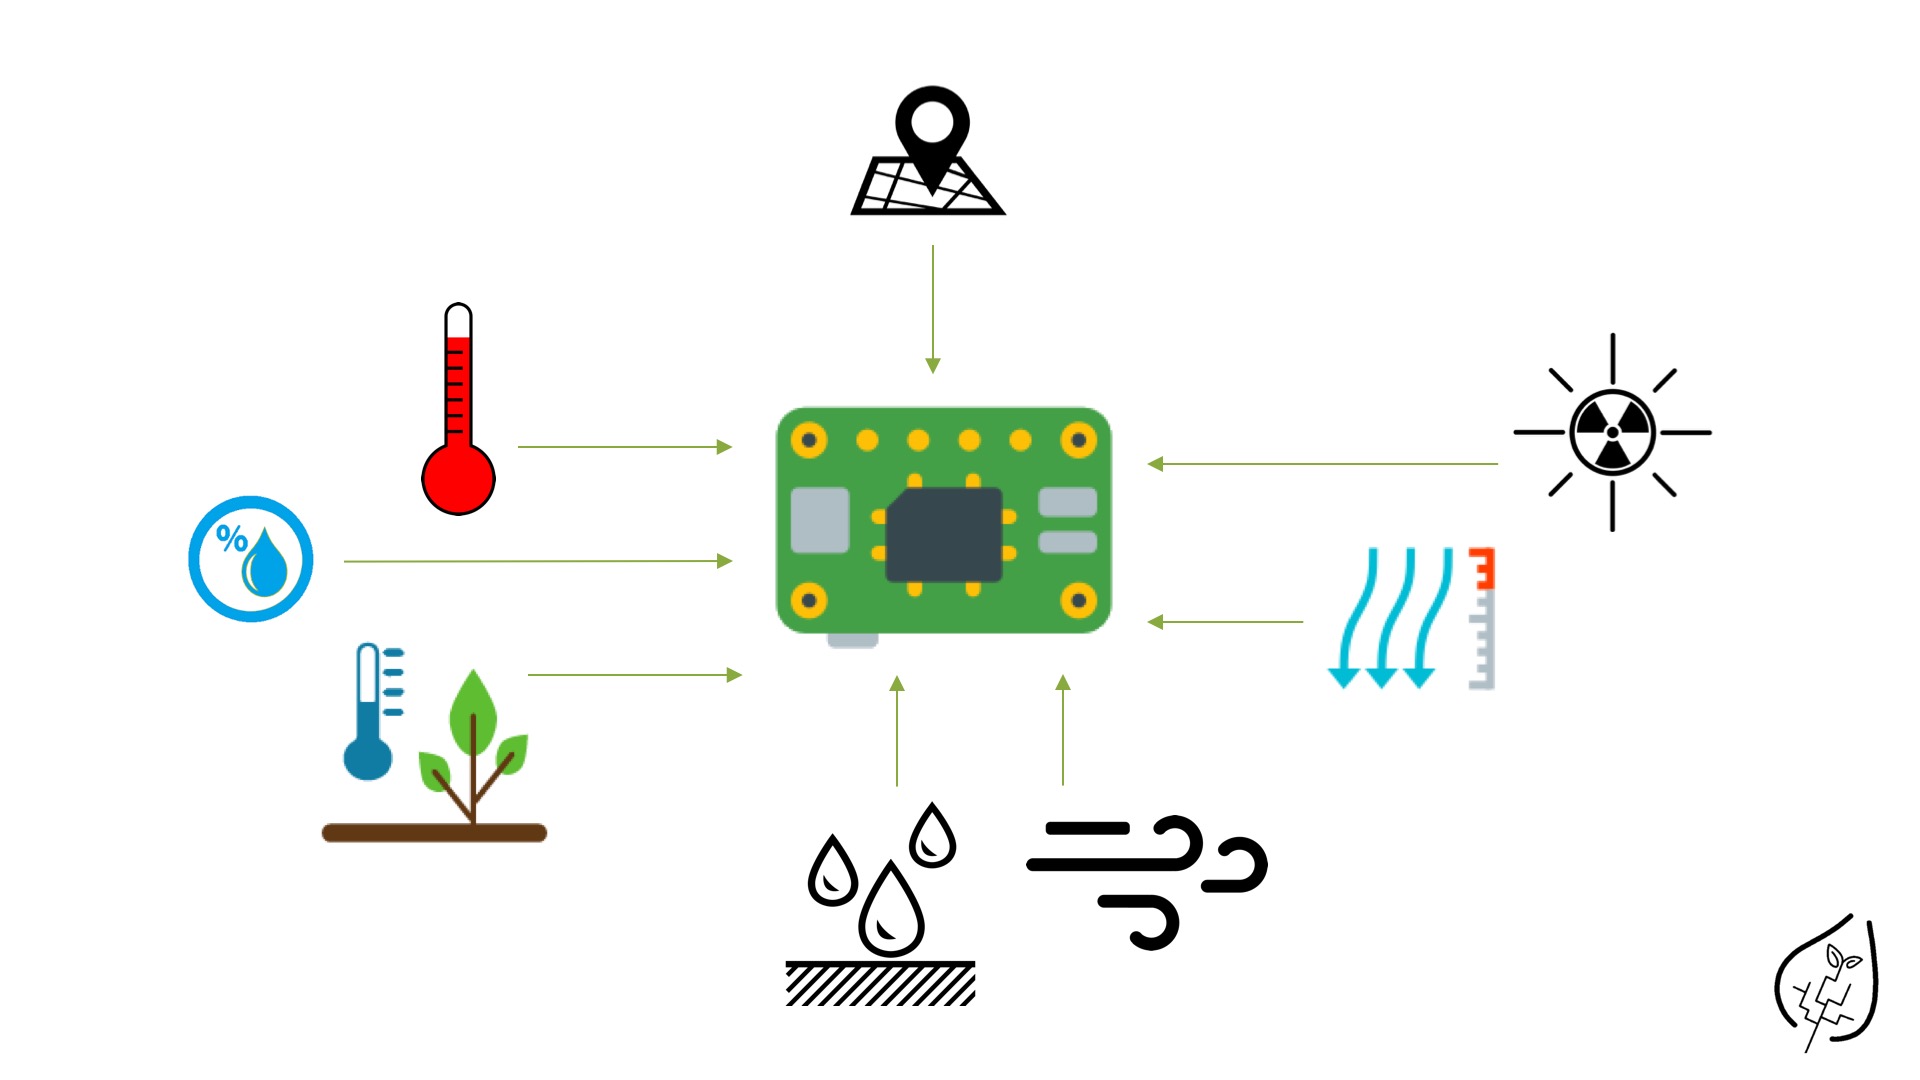
The Environmental Data Collection (EDC) System:
Agriboost is a system that relies on collecting data from the environment. This is done using a variety of above ground and underground sensors; which is stored locally and witlessly transmitted to the HUB, to ensure that data is collected.
The core of the EDC is a raspberry pi zero, as it allows us to easily implement a local database system and interface with multiple sensors and libraries based on different languages; at a low cost, while saving us precious development time which we would have needed trying to implement a local storage solution to store sensor data if the wireless connection is offline.
The EDC is also able to receive updates and change the ping rate it uses to gather data over longer or shorter time intervals.
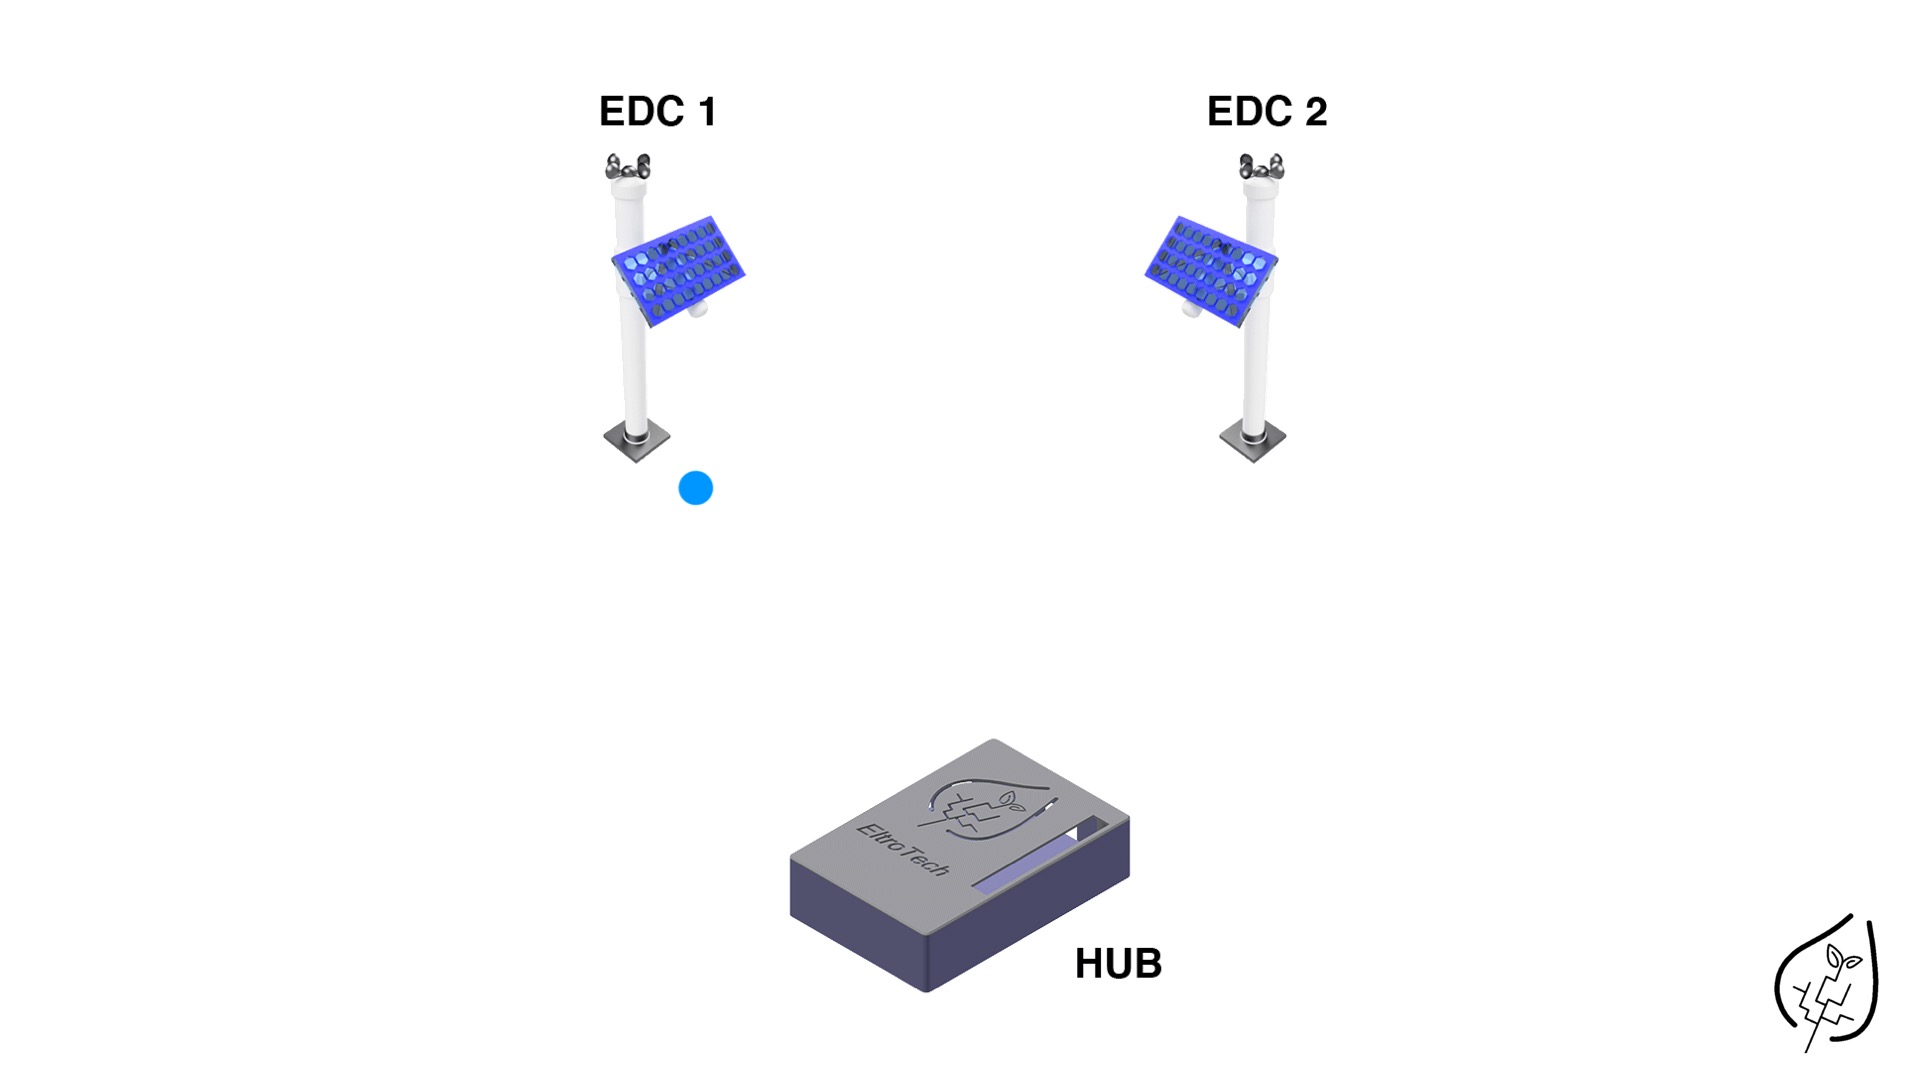
The Communication (COM) System:
Agribbost requires collecting data from a network of EDC nodes in the field to get an accurate representation of the current fields state as a whole. This requires a low power method of transmitting data from multiple nodes in the field to a single hub.
Using low cost off the shelf NRF24L01 transceiver and patching existing open source libraries to work with the latest version of Raspbian (Raspberry Pi Linux based operating system), the team designed and implemented an RSA based end to end encryption system to ensure the data being transmitted is not tampered with.
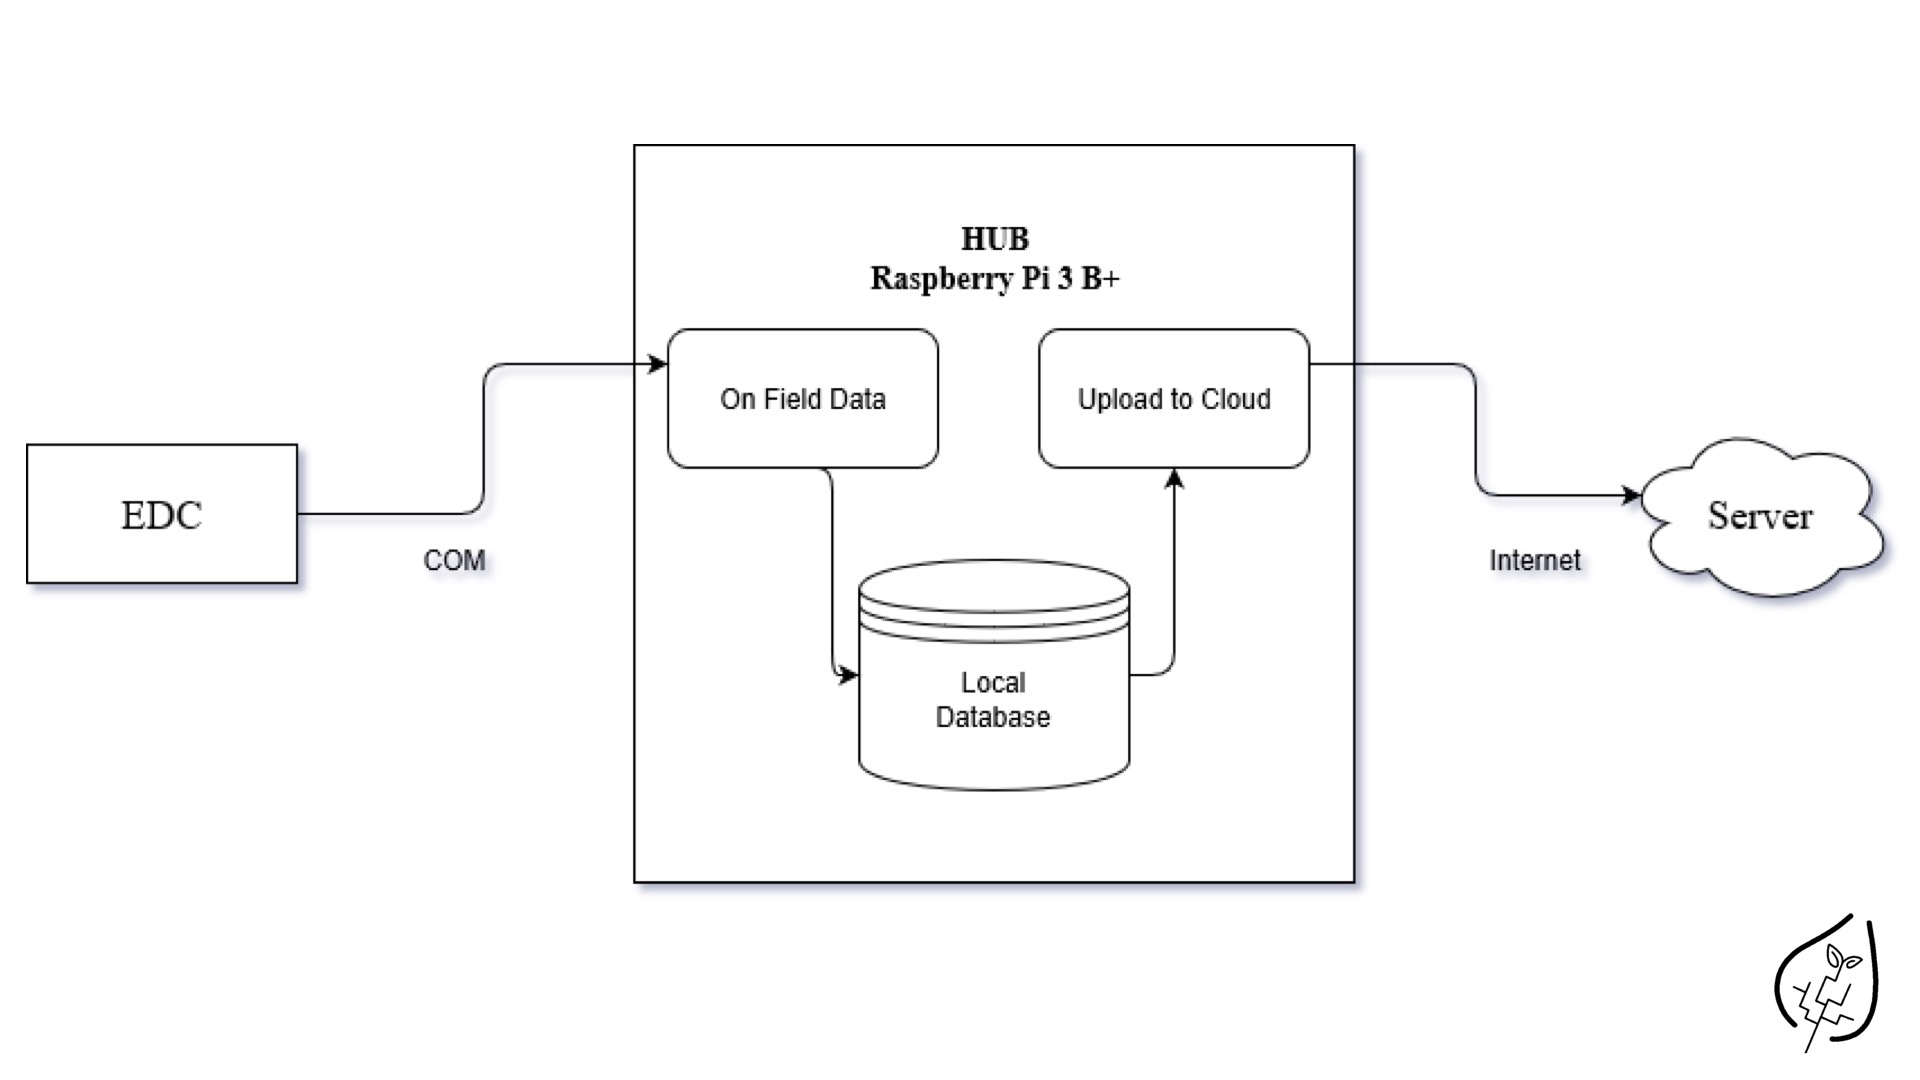
The HUB System:
Connects and receives data from all of the nodes in the field, storing it locally until an internet connection is found at which point the aggregated field data is sent to the server.
The HUB also acts as the intercommunication link between the server and the field nodes, passing on settings updates on from the server to the field nodes.
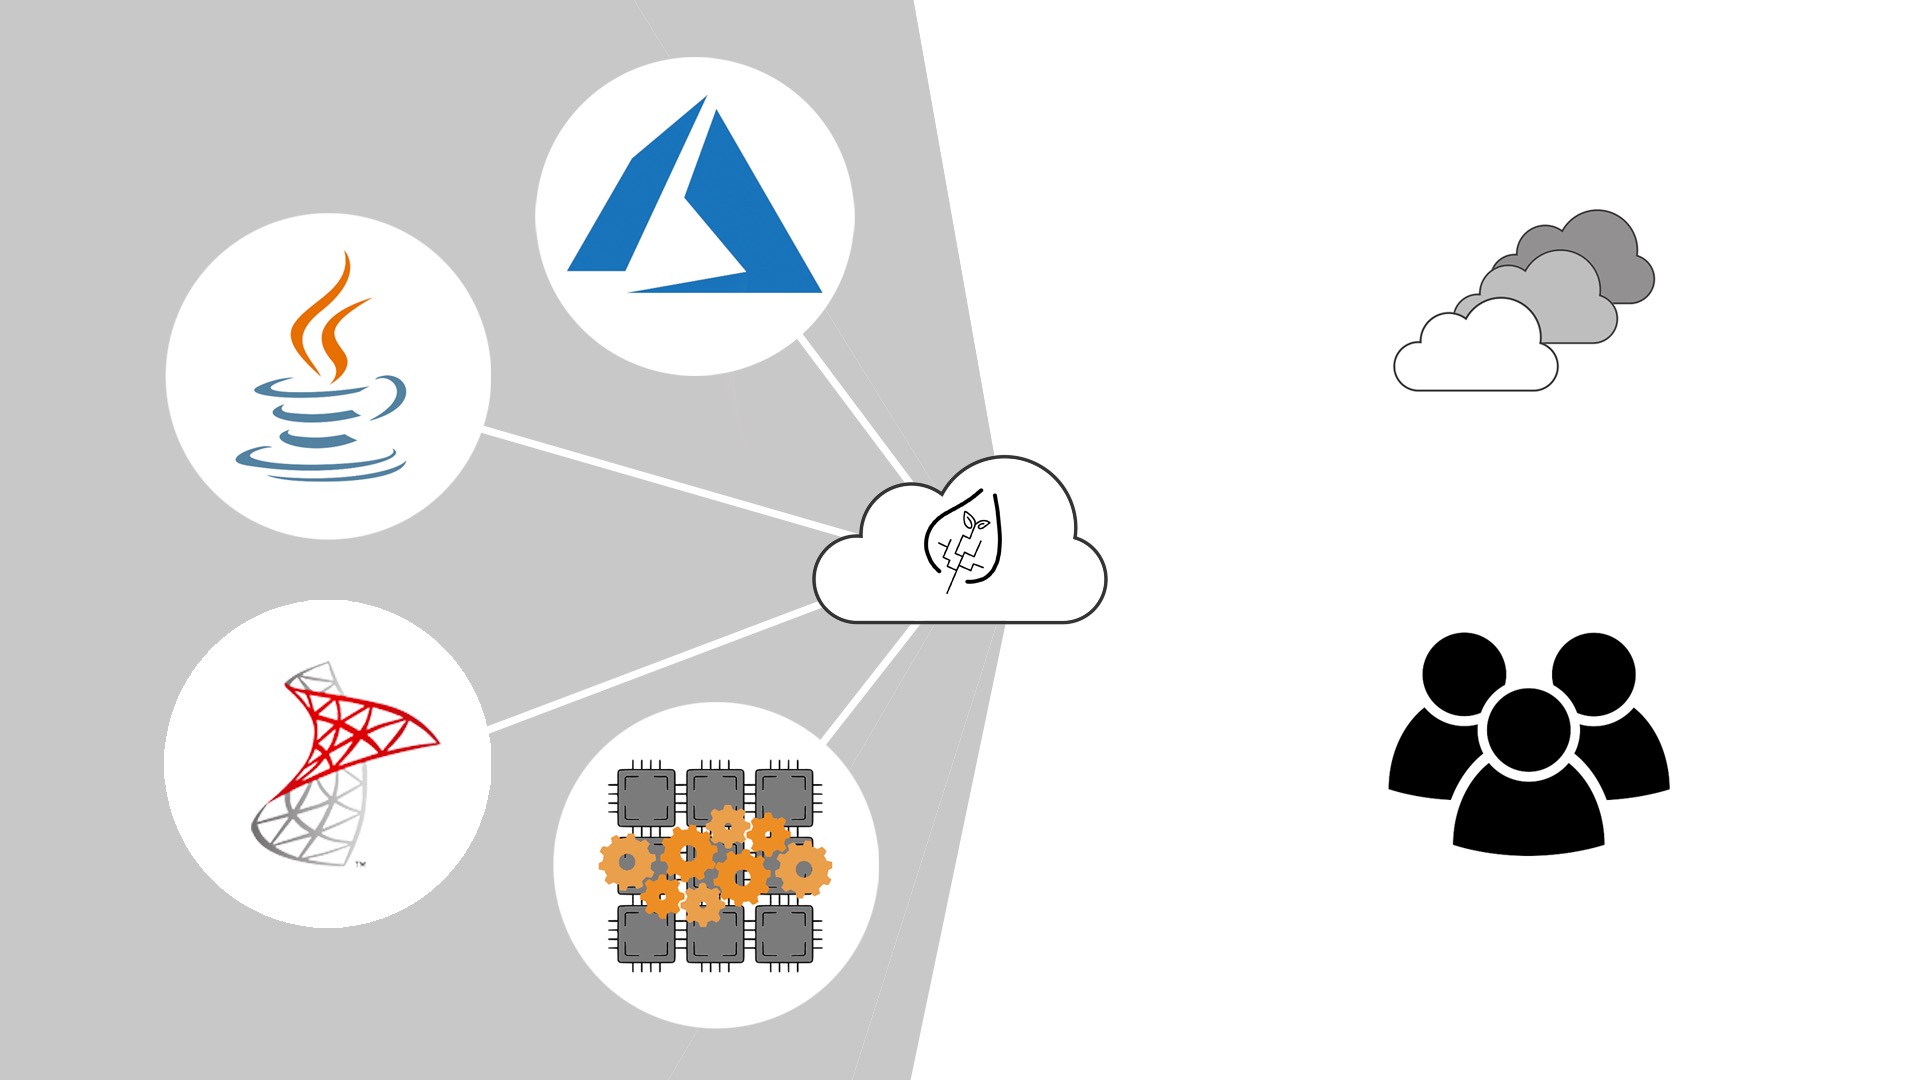
The Server is the intermediary between the field and the User Interface.
The server is built on the Java Spring framework, with a relational Microsoft SQL database to handle all the data.

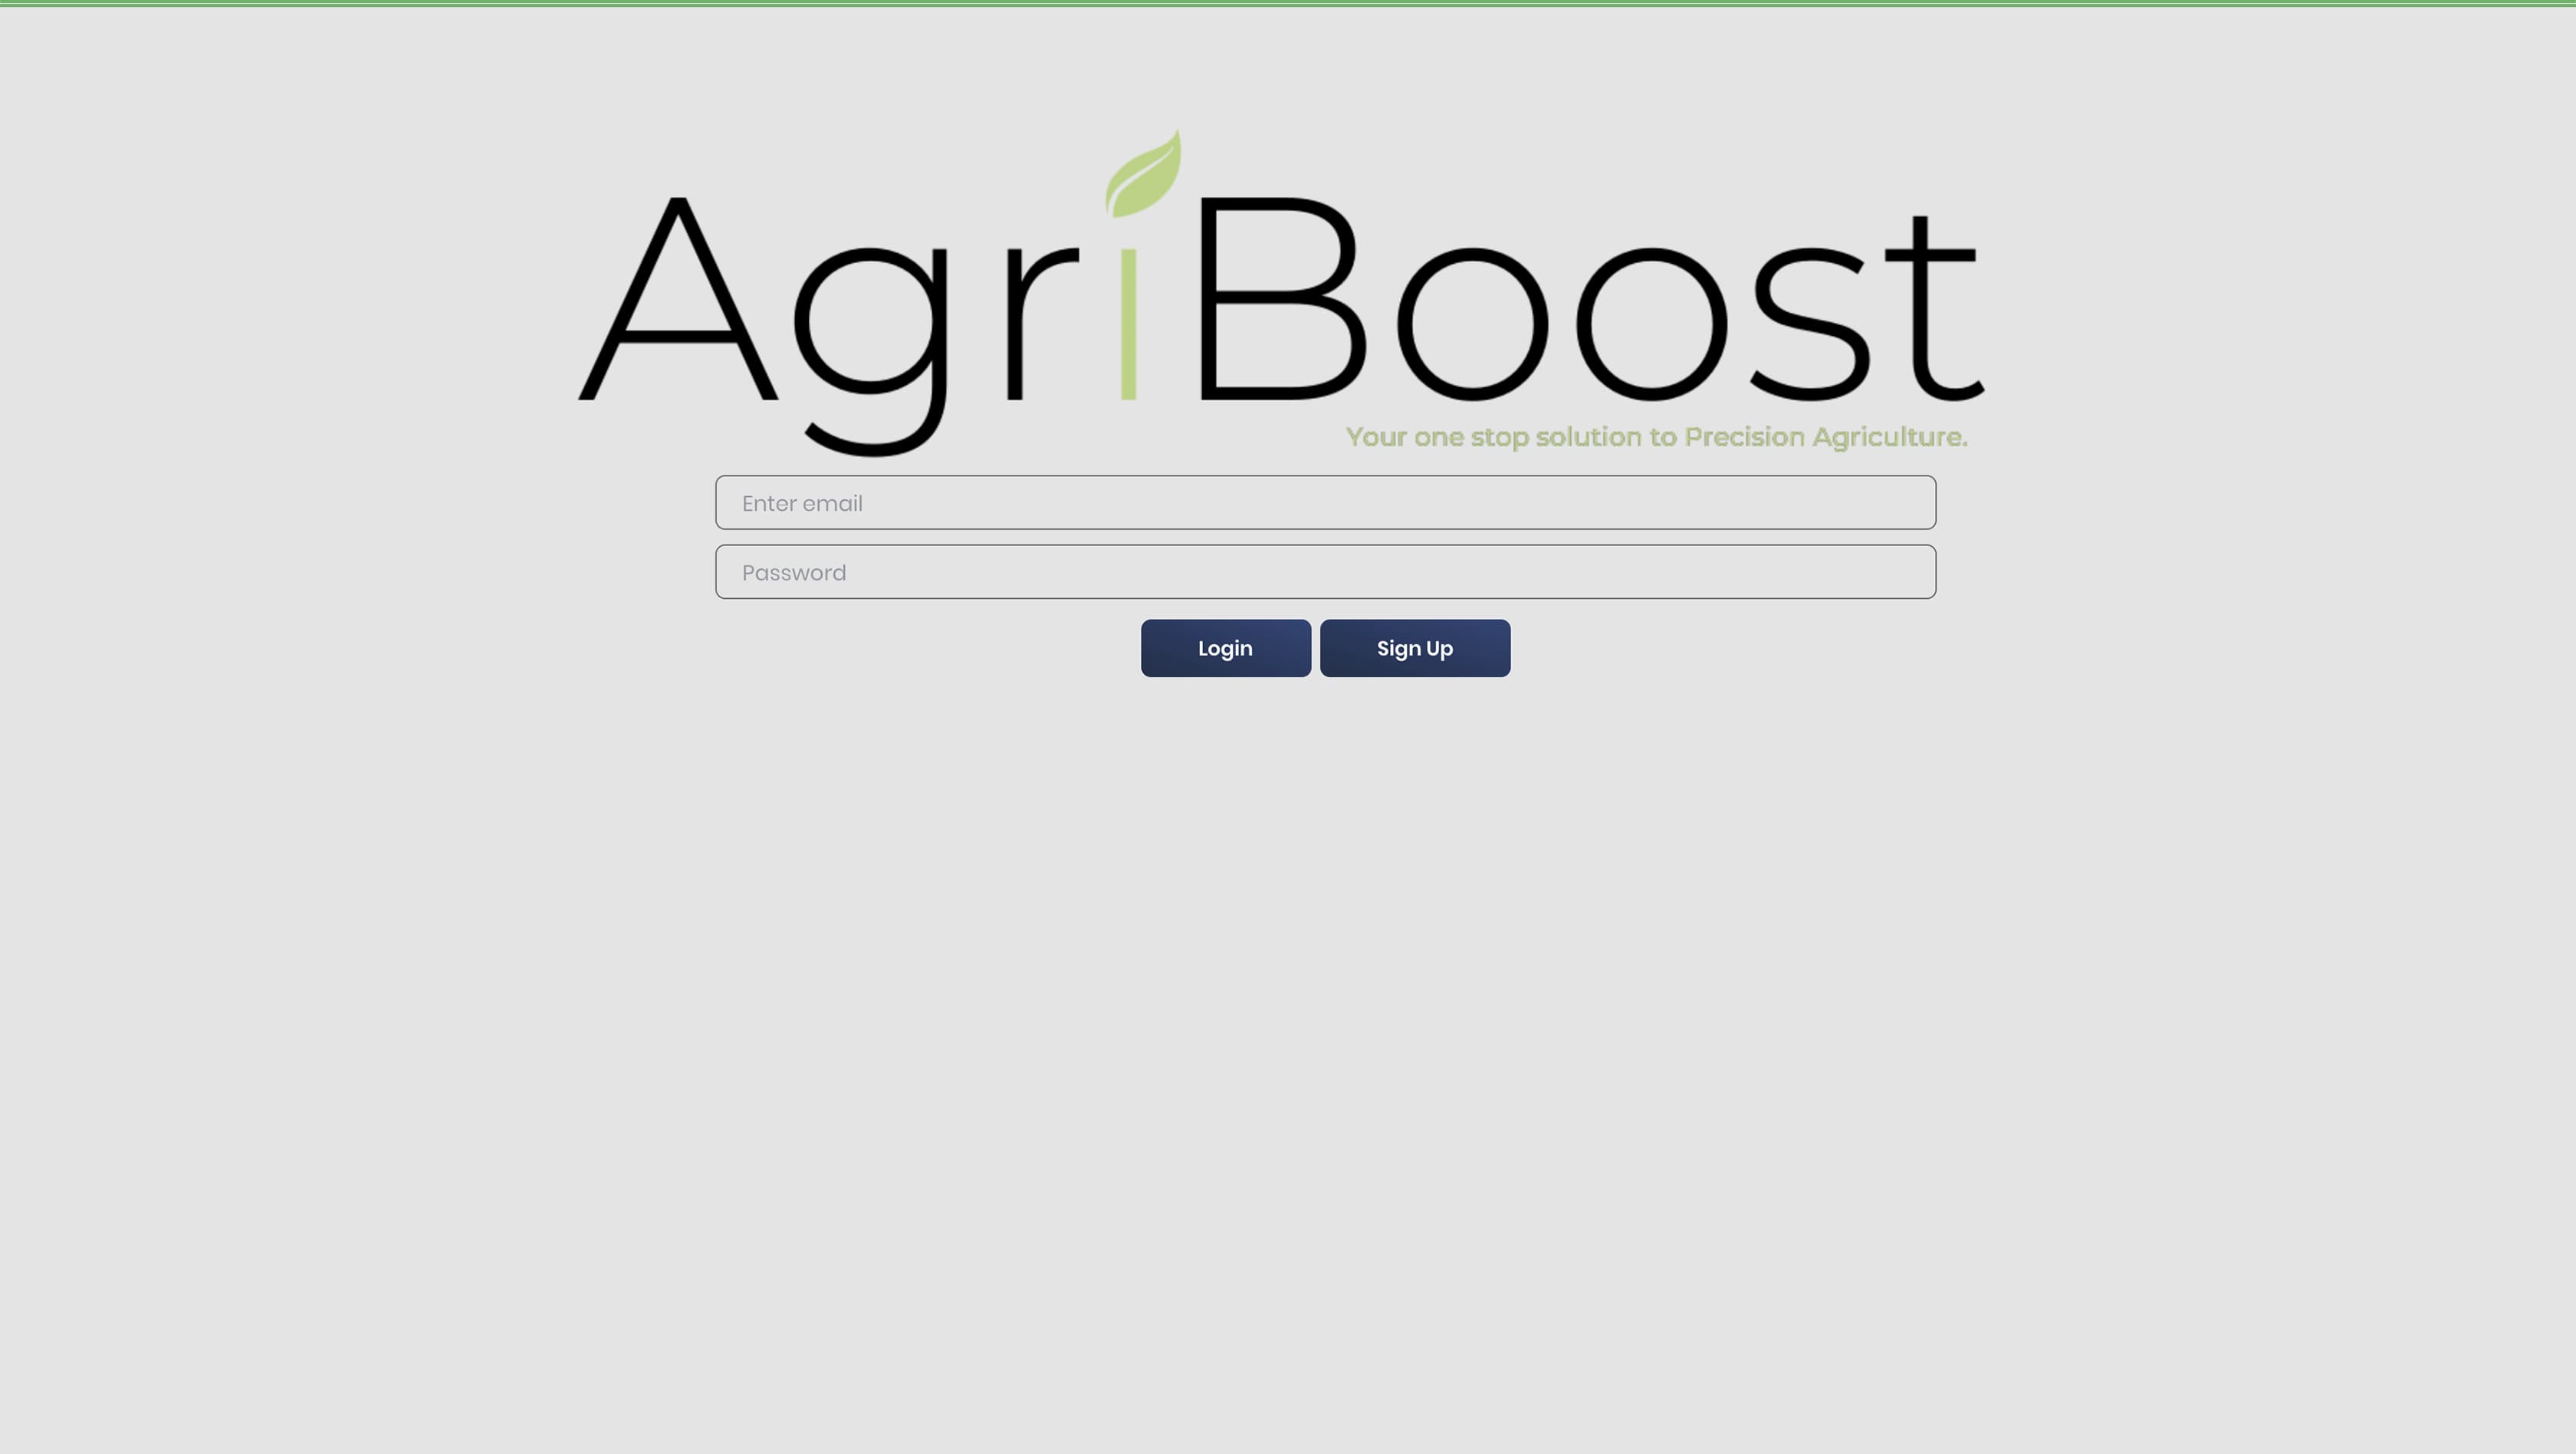
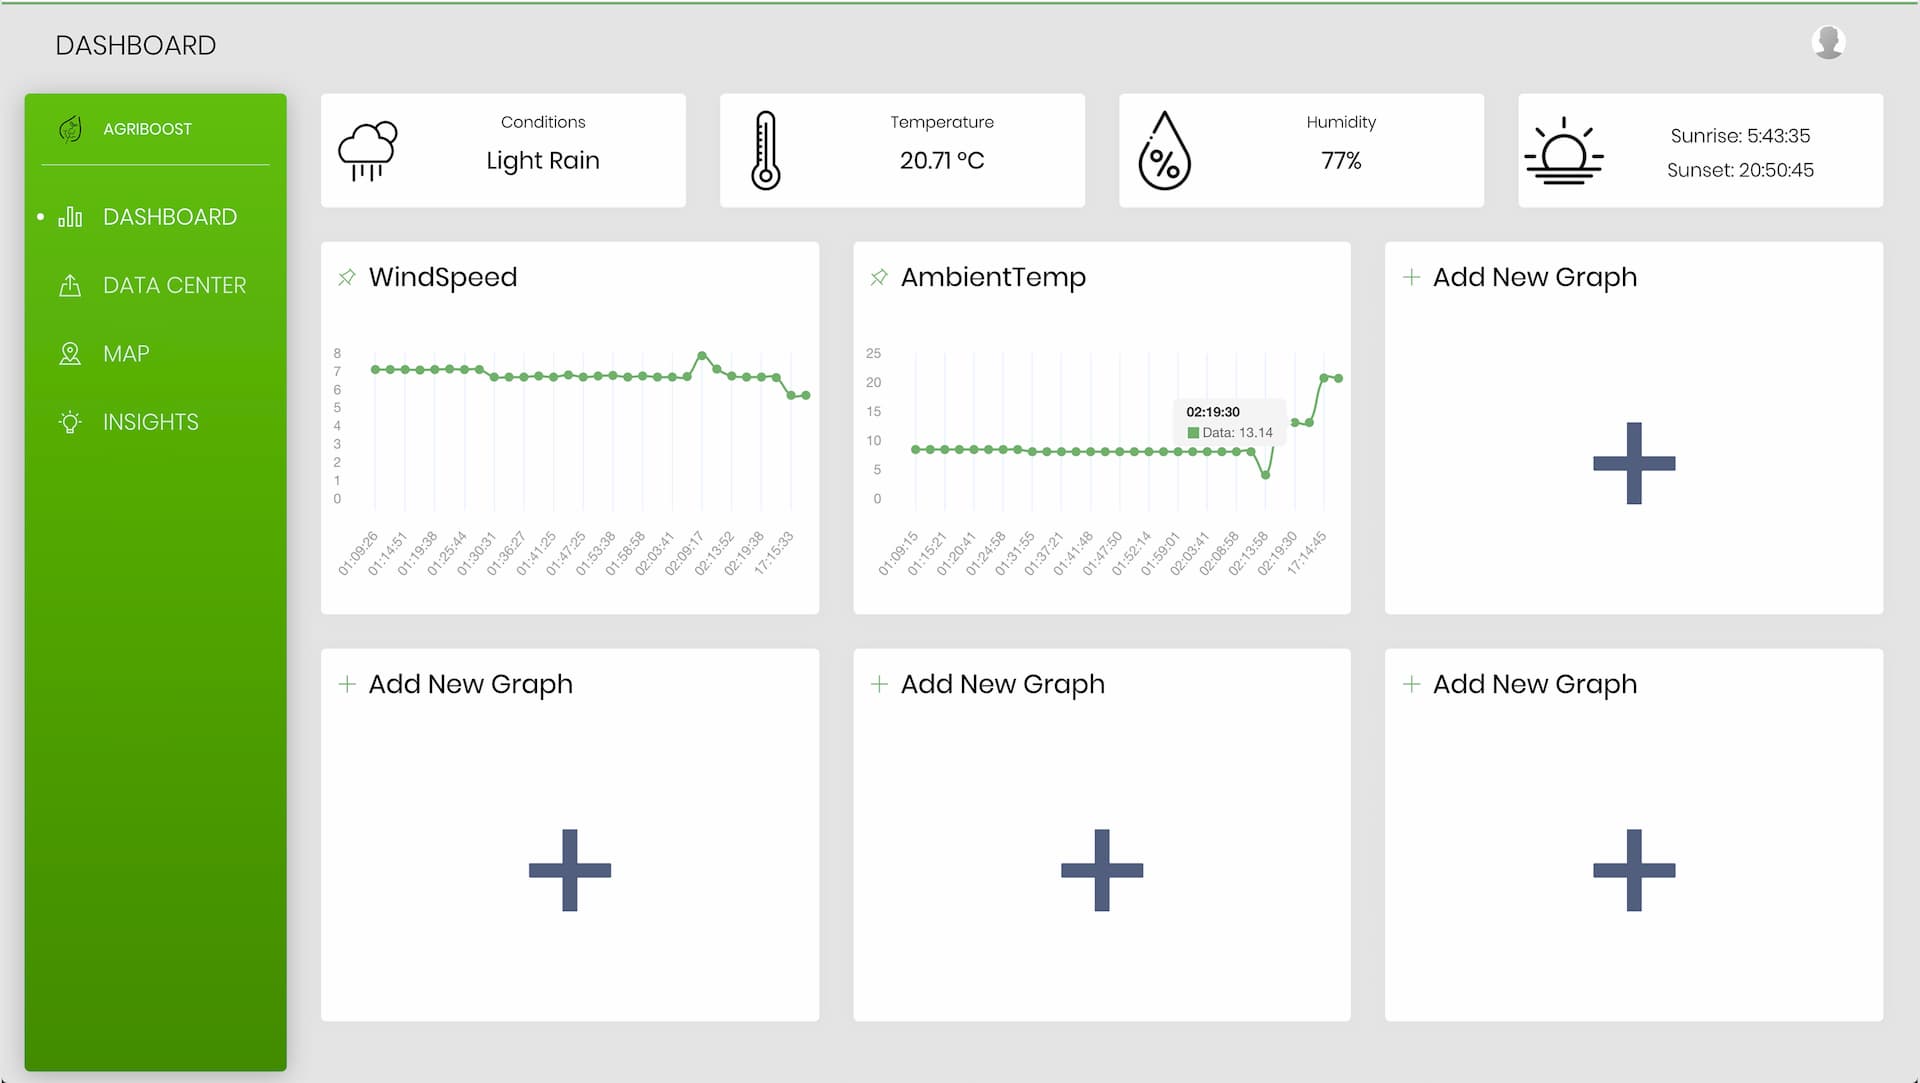
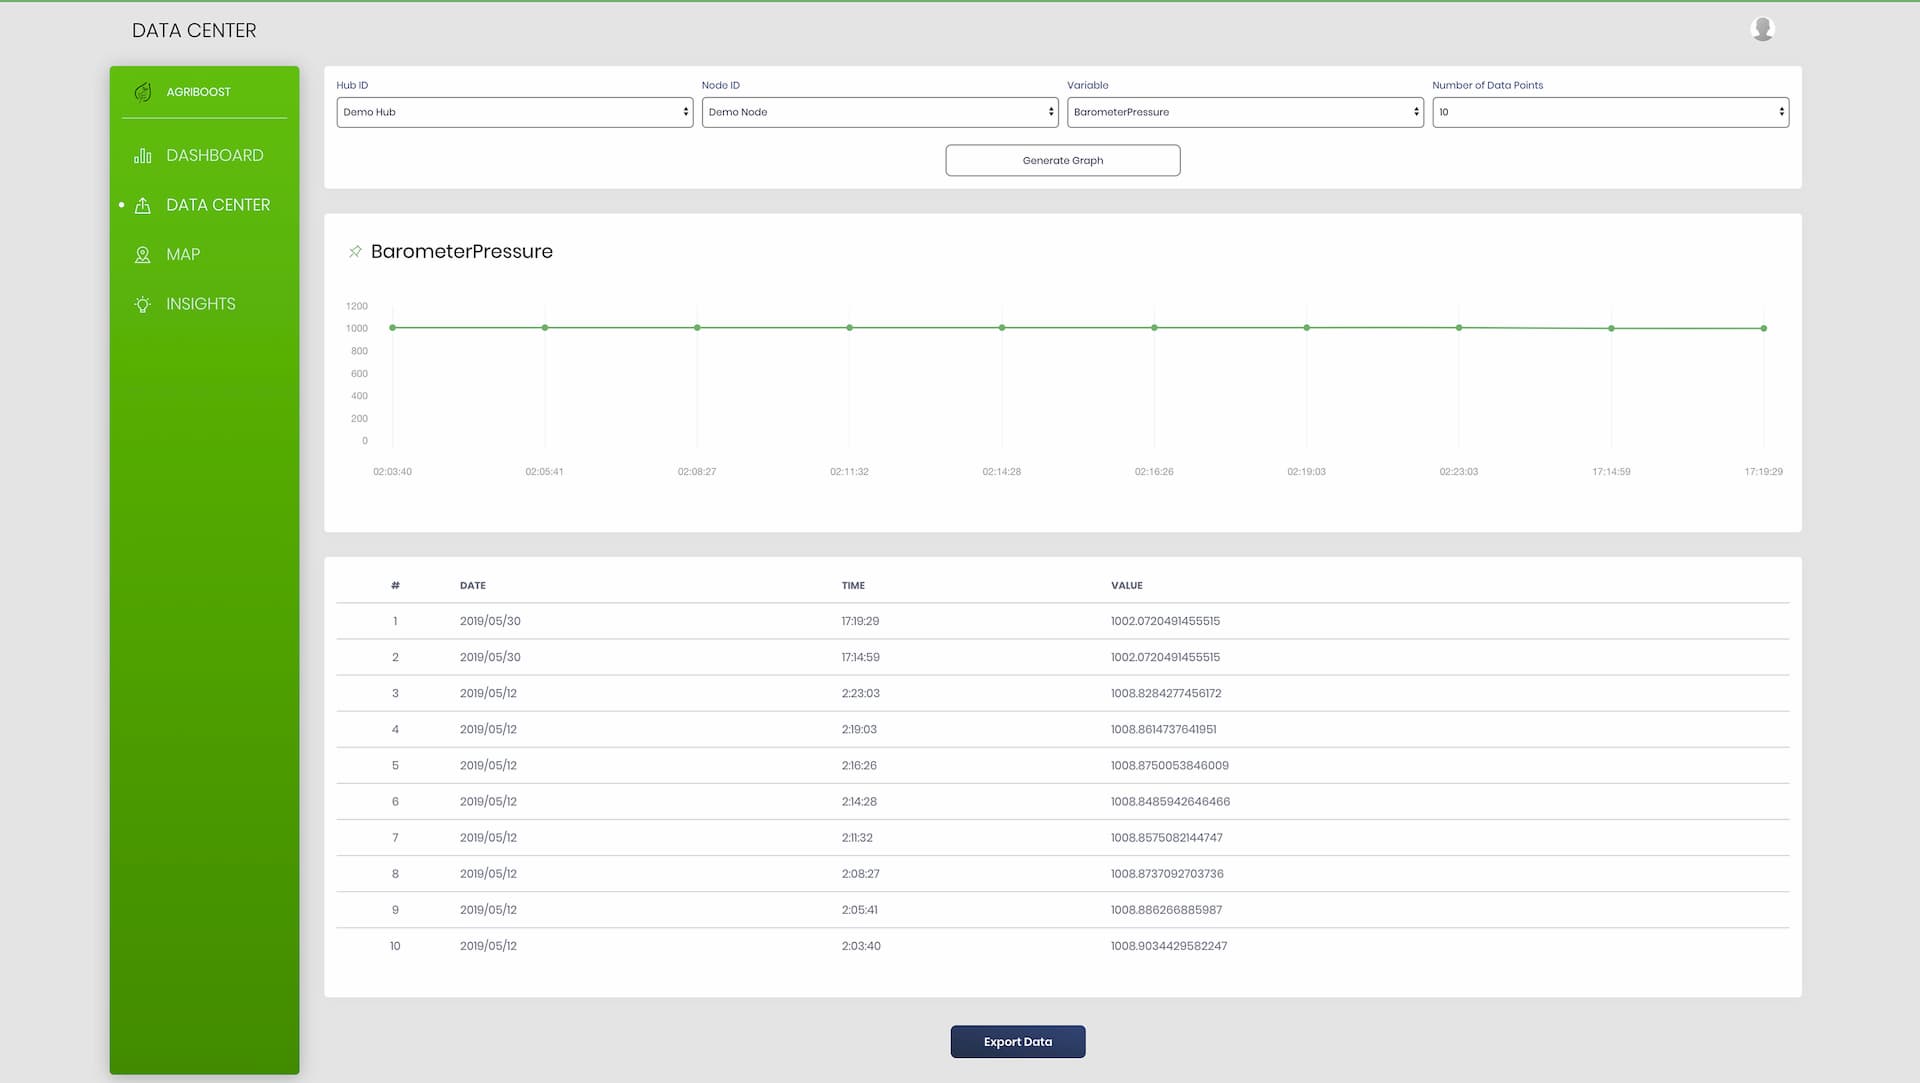
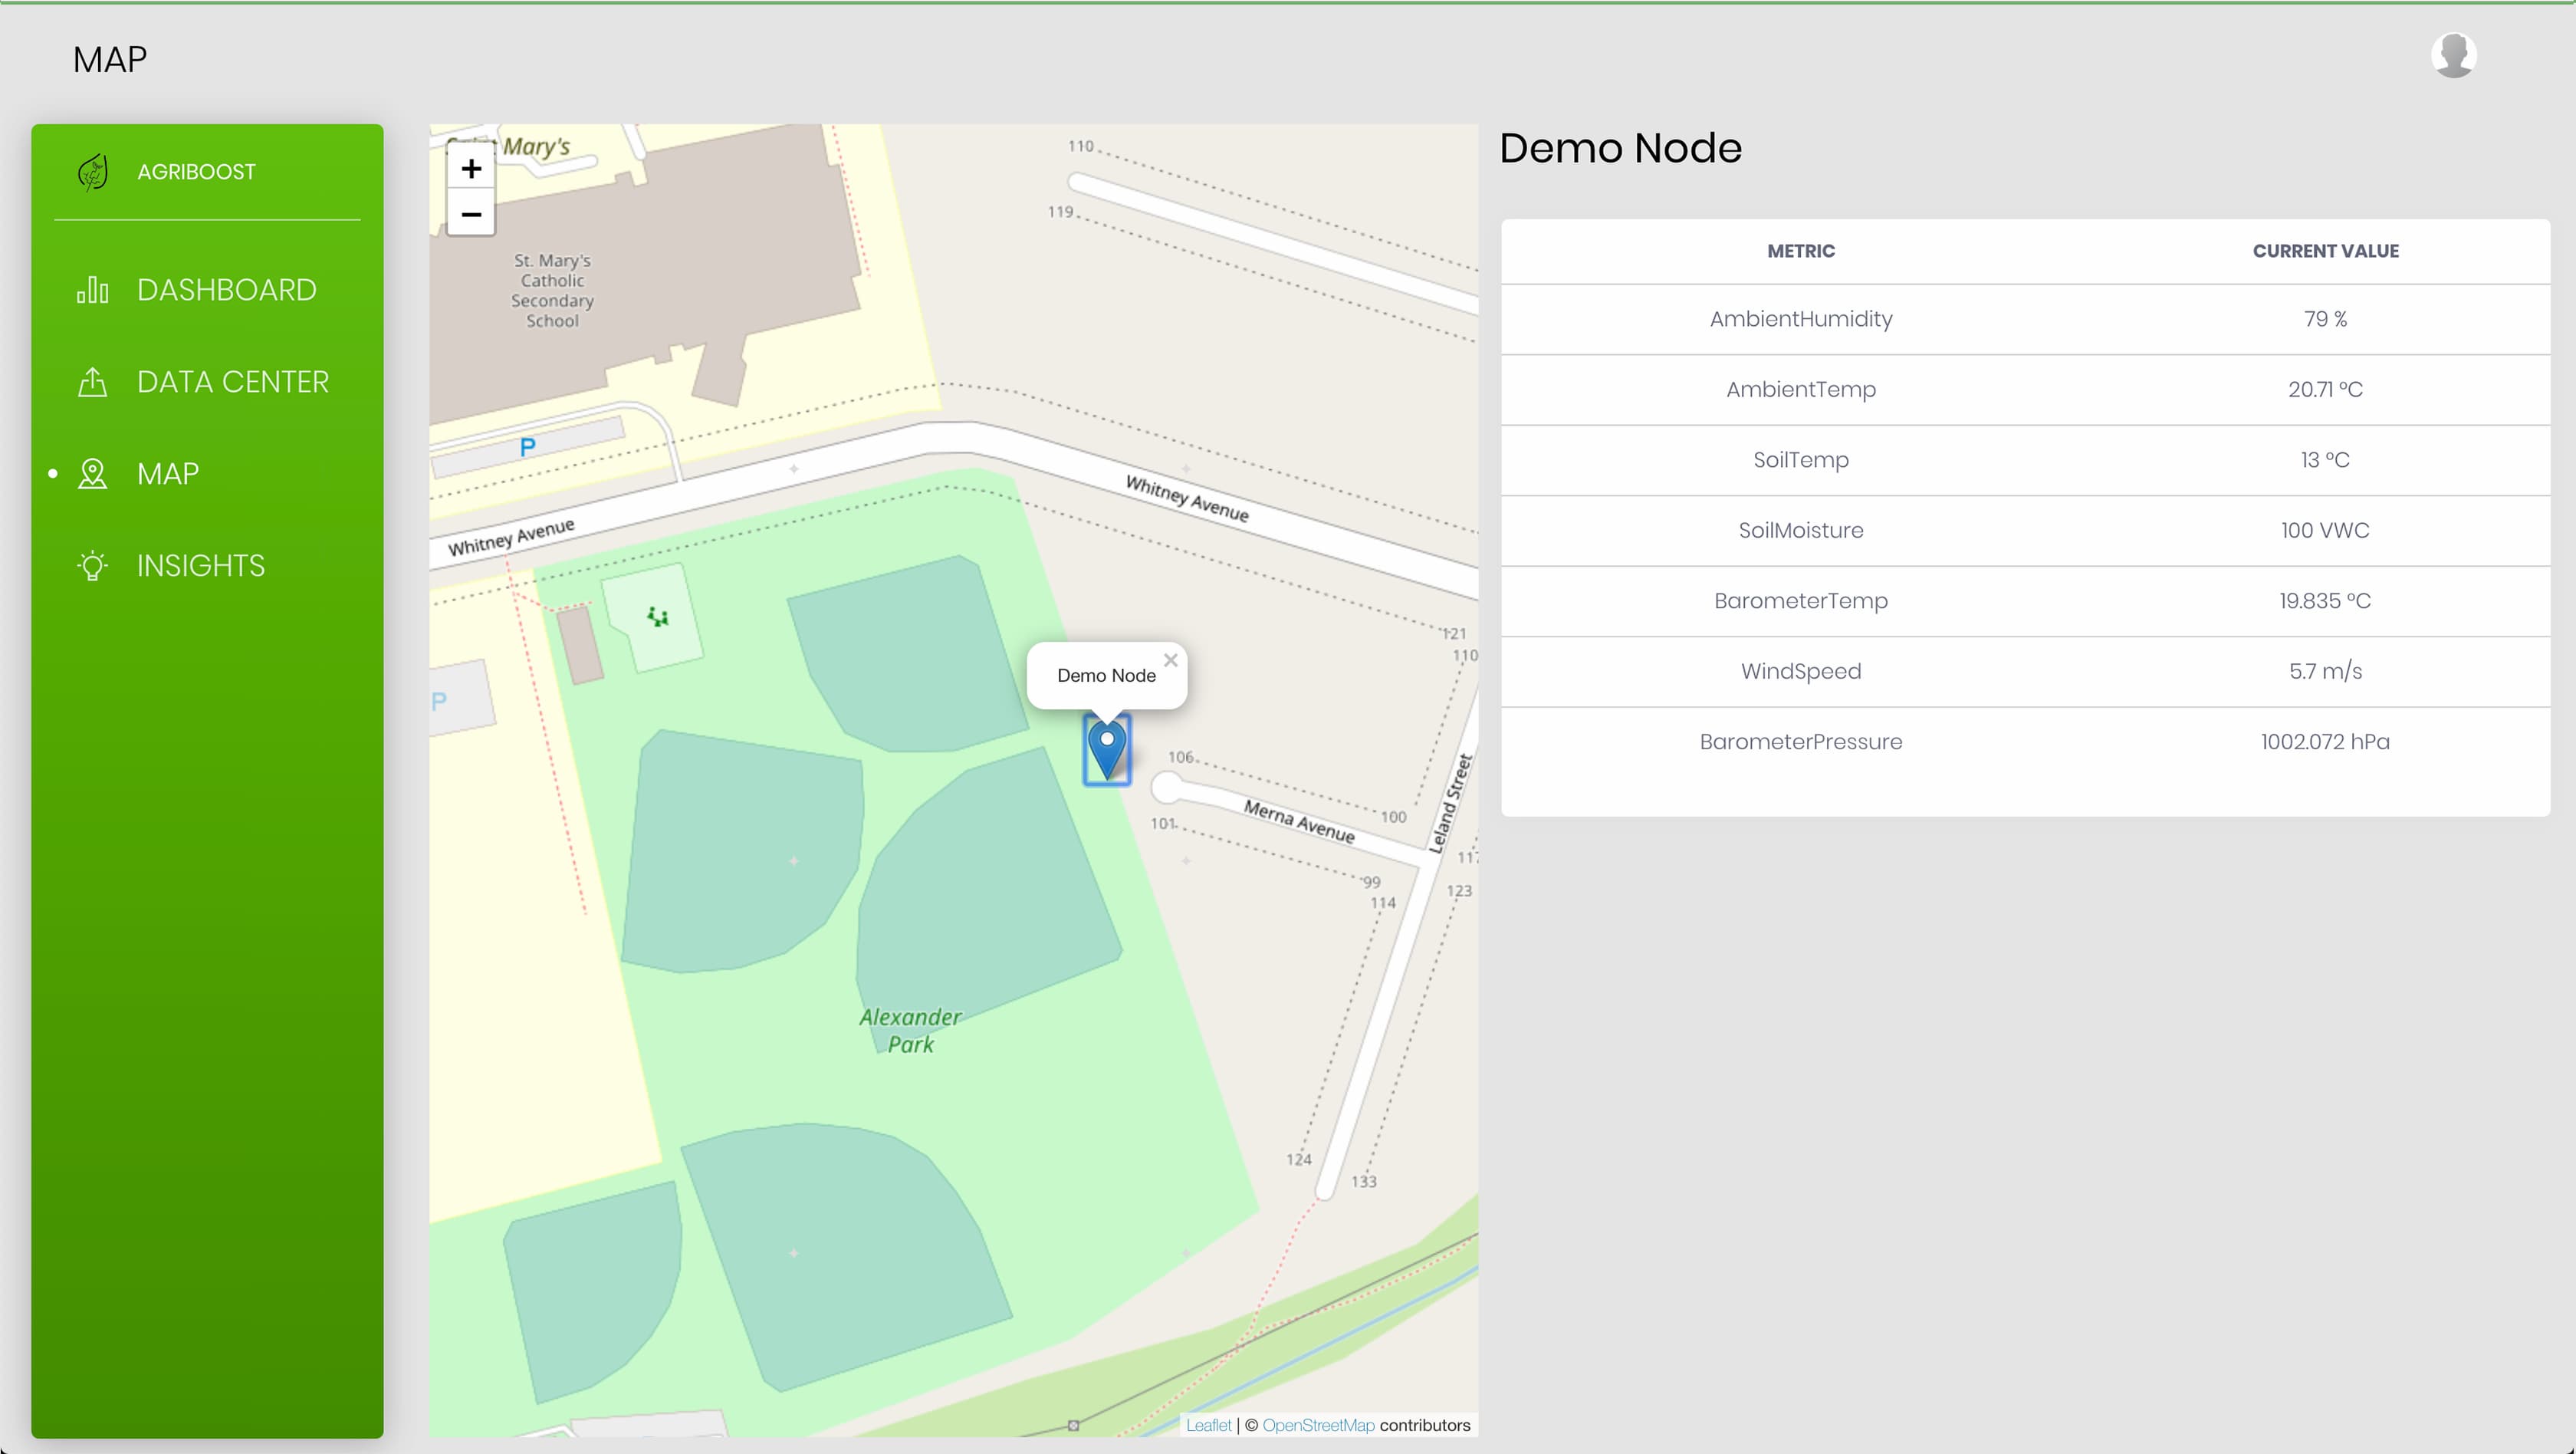
The User Interface (UI) is designed responsively and mobile first to ensure the farmer can access the app from their mobile phone, tablet or desktop computer and still have access to all the data that they desire.
The User Interface allows login and registration for multiple users to one farm and multiple farms to one user. Once logging there are 5 unique sections:
The joint capstone project between Mechtronics engineering and software engineering students was announced, and the 3 requirements were layed out:
- Software Aspect
- Mechanical Aspect
- Electrical Aspect
And the team was formed soon after
The team brainstormed plenty of ideas to meet the requirements, with internal and external ideas including but not limited to:
- Autonomous Chairs
- Autonomous Spotlight Tracking
- Omletter Making Robot
Then the team decided that we beleived could have a real positive impact across the globe. That being creating a system to assit in precision agriculture by monitoring field data and providing relavant recommendations and data to the farmer.
- Create contractual points for what we will deliver for April 2019.
- The team reached out to professors who do agriculture research and began reaching out to companies to sponsor the project
- The team completed initial research on what farmers would like in the system and what data would be useful to generate recommendations on
- Created system requirements to fulfill contractual points while meeting what we've researched our client the farmers to want.
- Determined the 7 key sub-systems for the Agriboost system
Team up with McMaster Museum of Art
Supervised by Dr.Noseworthy the team began work with the McMaster Museum of Art, to test our sensors against tried and tested technolgy and bring the museum into the modern era at the same time.
Open talks with Agriculture and Agrifood Canada, to get advice on server setup, data collection and data modelling. As well as completed sensor selection and software architecture selection for the system
Setup the Agriboost system in the Museum of Art
Establishing Server Providers, website hosting and database structure.
Initial System Design and software implementation
System Design reviewed and updated
Final software implementation begins
Key sub-system componets tested and normalized:
- Wirless Communication System
- Sensors
Systems Theoretic Process Analysis (STPA) Hazard analysis performed on system to identify key places for failure and hazards
- Development completed and tested for all sub-systems except the chassis which is explicitly a hardware housing.
- Subsystems Integrated
- Full System testing begins, Machine Learning models tested
- Chassis Manufacturing Completed
Final Capstone presentations to a panel of industry judges earning First Place of all the capstones presented this year, for our agriculture focused sensor network and analysis system